The Green Bay Packers are dominating the NFL early and lead the FTN DVOA ratings after two weeks. In fact, the Packers are No. 1 in both offense and defense after two weeks. We are not yet including opponent adjustments in DVOA but the Packers would rank even better if we were, given that they’ve played Detroit and Washington who each were strong teams last year and won big in their other game in 2025. The Packers are the first team to rank No. 1 in both offense and defense after a given week since the 2014 Broncos after Week 13.
That would make you think the Packers are clear favorites to win Super Bowl LX, but not so fast. The record of teams that lead the league in both offense and defense is not as great as you might think, even when we’re talking about teams that did it late in the season. The only team to be No. 1 in both offense and defense with the current version of DVOA was the 2001 St. Louis Rams, who lost the Super Bowl to the Patriots in a huge upset. The Rams and Packers are among 11 different teams that were No. 1 on both sides of the ball at some point, and only one of those teams won the Super Bowl: the 2009 New Orleans Saints.
| Teams Ranked No. 1 DVOA in Offense and Defense, 1978-2025 | ||||||||||
| Year | Week | Team | W-L | Off | Rk | Def | Rk | ST | Rk | Playoffs |
| 1980 | 3 | PHI | 3-0 | 38.1% | 1 | -31.6% | 1 | 1.0% | 12 | Lost SB |
| 1990 | 2 | CHI | 2-0 | 31.4% | 1 | -39.7% | 1 | 5.3% | 5 | Lost DIV |
| 1994 | 8 | DAL | 6-1 | 24.1% | 1 | -18.6% | 1 | 2.4% | 8 | Lost CCG |
| 1994 | 12 | DAL | 9-2 | 20.3% | 1 | -16.2% | 1 | 3.2% | 6 | Lost CCG |
| 1994 | 13 | DAL | 10-2 | 22.6% | 1 | -14.4% | 1 | 3.8% | 4 | Lost CCG |
| 1998 | 1 | SEA | 1-0 | 50.4% | 1 | -56.1% | 1 | 5.5% | 10 | None |
| 2001 | 16 | STL | 13-2 | 20.5% | 1 | -15.8% | 1 | -5.1% | 28 | Lost SB |
| 2001 | 17 | STL | 14-2 | 20.8% | 1 | -16.8% | 1 | -6.4% | 29 | Lost SB |
| 2003 | 6 | TB | 3-2 | 25.1% | 1 | -23.1% | 1 | -6.5% | 30 | None |
| 2003 | 7 | MIN | 6-0 | 23.8% | 1 | -18.9% | 1 | -5.9% | 30 | None |
| 2007 | 11 | NE | 10-0 | 44.6% | 1 | -21.5% | 1 | 7.3% | 4 | Lost SB |
| 2009 | 6 | NO | 5-0 | 35.9% | 1 | -23.1% | 1 | -7.7% | 29 | Won SB |
| 2014 | 10 | DEN | 7-2 | 23.2% | 1 | -23.1% | 1 | -4.3% | 25 | Lost DIV |
| 2014 | 13 | DEN | 9-3 | 22.3% | 1 | -19.7% | 1 | -4.9% | 28 | Lost DIV |
| 2025 | 2 | GB | 2-0 | 29.0% | 1 | -34.6% | 1 | -8.8% | 28 | — |
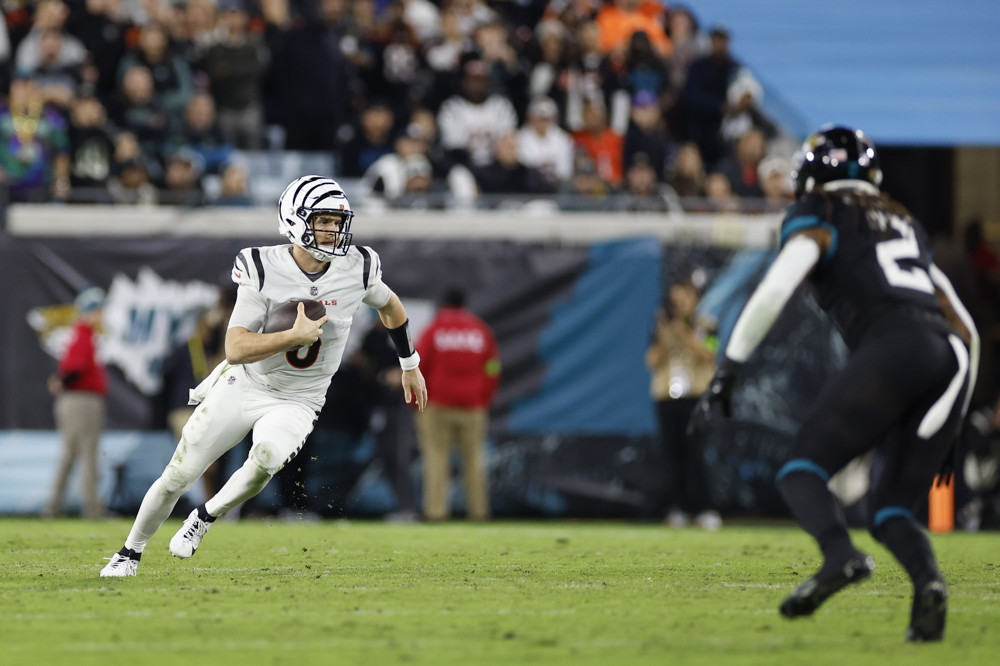
The league’s other 2-0 teams are stretched out across the DVOA table after the Packers. The two Los Angeles teams rank second (Rams) and third (Chargers), followed by the 1-1 Ravens because DVOA loved them so much despite the Week 1 loss to Buffalo. The surprising Indianapolis Colts are fifth, currently ranking in the top 10 for both offense and defense. But the Cincinnati Bengals are only 16th at 2-0, before we even consider the injury to Joe Burrow, and the Tampa Bay Buccaneers are just 19th with two very close wins over Atlanta (23-20) and Houston (20-19). The Bucs are really hurt by ranking dead last in special teams so far this season.
It’s also worth noting that while the Kansas City Chiefs are struggling at 0-2, they are the top 0-2 team in DVOA without even including opponent adjustments yet for playing strong Chargers and Eagles teams.
* * * * *
These are the FTN DVOA and DAVE ratings through two weeks of 2025. Our Defense-adjusted Value Over Average (DVOA) system breaks down every single play and compares a team’s performance to the league average based on situation in order to determine value over average. (Explained further here.) Please note that there are no opponent adjustments in DVOA until after Week 4.
OFFENSE and DEFENSE DVOA are adjusted for performance indoors and consider all fumbles, kept or lost, as equal value. SPECIAL TEAMS DVOA is adjusted for type of stadium (warm, cold, dome, Denver) and week of season. As always, positive numbers represent more points so DEFENSE is better when it is NEGATIVE.

DAVE is a formula which combines our preseason forecast with current DVOA to get a more accurate projection of how a team will play the rest of the season. DAVE is currently 73% preseason forecast for offense and 94% preseason forecast for defense and special teams. Cincinnati’s DAVE is adjusted so the forecast reflects Jake Browning as quarterback instead of Joe Burrow.
| RK | TEAM | TOTAL DVOA |
LAST WEEK |
TOTAL DAVE |
RK | W-L | OFF. DVOA |
OFF. RK |
DEF. DVOA |
DEF. RK |
S.T. DVOA |
S.T. RK |
|---|---|---|---|---|---|---|---|---|---|---|---|---|
| 1 | GB | 54.8% | 3 | 14.6% | 4 | 2-0 | 29.0% | 1 | -34.6% | 1 | -8.8% | 28 |
| 2 | LAR | 41.6% | 8 | 10.1% | 9 | 2-0 | 20.9% | 5 | -17.6% | 6 | 3.2% | 10 |
| 3 | LAC | 39.0% | 11 | 4.1% | 12 | 2-0 | 17.9% | 8 | -20.9% | 4 | 0.2% | 19 |
| 4 | BAL | 34.6% | 6 | 25.6% | 1 | 1-1 | 22.7% | 2 | -3.3% | 14 | 8.6% | 4 |
| 5 | IND | 32.0% | 2 | -9.2% | 26 | 2-0 | 20.8% | 6 | -13.9% | 8 | -2.7% | 24 |
| 6 | SEA | 26.3% | 21 | -1.6% | 15 | 1-1 | 2.8% | 14 | -13.6% | 9 | 9.9% | 2 |
| 7 | ARI | 25.5% | 17 | 4.5% | 10 | 2-0 | 4.4% | 13 | -21.2% | 3 | -0.2% | 20 |
| 8 | JAX | 25.1% | 4 | 2.1% | 14 | 1-1 | 8.9% | 10 | -15.3% | 7 | 0.9% | 17 |
| 9 | DET | 21.4% | 30 | 18.9% | 3 | 1-1 | 18.7% | 7 | -7.1% | 13 | -4.4% | 25 |
| 10 | ATL | 19.6% | 22 | -3.3% | 19 | 1-1 | -4.8% | 20 | -23.5% | 2 | 0.9% | 16 |
| 11 | BUF | 18.7% | 26 | 20.3% | 2 | 2-0 | 21.9% | 3 | 2.9% | 20 | -0.3% | 21 |
| 12 | PHI | 17.4% | 9 | 13.9% | 5 | 2-0 | 9.5% | 9 | 1.1% | 17 | 9.1% | 3 |
| 13 | SF | 12.6% | 15 | 12.8% | 7 | 2-0 | 8.2% | 11 | -18.5% | 5 | -14.1% | 31 |
| 14 | WAS | 11.1% | 1 | 12.2% | 8 | 1-1 | 2.3% | 15 | -7.1% | 12 | 1.6% | 13 |
| 15 | DEN | 3.5% | 5 | 4.5% | 11 | 1-1 | -2.3% | 19 | -11.9% | 11 | -6.1% | 26 |
| 16 | CIN | 3.0% | 16 | -4.9% | 22 | 2-0 | 0.8% | 18 | -0.5% | 15 | 1.6% | 14 |
| RK | TEAM | TOTAL DVOA |
LAST WEEK |
TOTAL DAVE |
RK | W-L | OFF. DVOA |
OFF. RK |
DEF. DVOA |
DEF. RK |
S.T. DVOA |
S.T. RK |
| 17 | DAL | 0.8% | 14 | -2.0% | 16 | 1-1 | 21.7% | 4 | 26.7% | 29 | 5.8% | 8 |
| 18 | KC | -6.6% | 24 | 13.1% | 6 | 0-2 | 1.0% | 17 | 14.0% | 25 | 6.4% | 7 |
| 19 | TB | -9.6% | 13 | 3.3% | 13 | 2-0 | 8.1% | 12 | 2.6% | 19 | -15.1% | 32 |
| 20 | LV | -15.1% | 7 | -4.8% | 21 | 1-1 | -16.8% | 27 | -0.5% | 16 | 1.3% | 15 |
| 21 | NYJ | -15.6% | 10 | -15.7% | 30 | 0-2 | -7.5% | 23 | 14.9% | 26 | 6.9% | 5 |
| 22 | HOU | -17.0% | 25 | -2.1% | 17 | 0-2 | -12.8% | 25 | 10.7% | 24 | 6.5% | 6 |
| 23 | NO | -19.6% | 18 | -14.1% | 28 | 0-2 | -5.4% | 21 | 7.4% | 21 | -6.9% | 27 |
| 24 | CLE | -23.1% | 20 | -14.9% | 29 | 0-2 | -22.7% | 29 | -12.0% | 10 | -12.5% | 30 |
| 25 | PIT | -27.2% | 19 | -5.7% | 23 | 1-1 | -7.3% | 22 | 20.5% | 27 | 0.6% | 18 |
| 26 | MIN | -28.9% | 12 | -2.5% | 18 | 1-1 | -29.1% | 30 | 1.9% | 18 | 2.2% | 12 |
| 27 | MIA | -31.6% | 31 | -7.7% | 24 | 0-2 | -13.3% | 26 | 20.5% | 28 | 2.2% | 11 |
| 28 | NYG | -34.0% | 32 | -11.3% | 27 | 0-2 | -11.1% | 24 | 28.0% | 31 | 5.0% | 9 |
| 29 | NE | -34.5% | 27 | -8.5% | 25 | 1-1 | 2.2% | 16 | 27.3% | 30 | -9.4% | 29 |
| 30 | TEN | -42.0% | 28 | -22.1% | 31 | 0-2 | -43.3% | 32 | 9.1% | 22 | 10.4% | 1 |
| 31 | CAR | -42.6% | 29 | -24.8% | 32 | 0-2 | -30.3% | 31 | 9.7% | 23 | -2.6% | 23 |
| 32 | CHI | -49.7% | 23 | -4.2% | 20 | 0-2 | -18.8% | 28 | 28.7% | 32 | -2.2% | 22 |
Source link


