A total of 11 studies were included in this meta-analysis, including 6 studies on GLP-1 RA, 1 study on GLP-1 and GIP dual receptor agonists, 1 study on orlistat, 2 studies on phentermine-topiramate, and 1 study on naltrexone-bupropion (Additional file 1: Table S2) [22,23,24,25,26,27,28,29,30,31,32]. There were 8 placebo controls and 3 active drug controls studies with 1573 participants in the treatment group and 893 in the control group. The baseline characteristics and risk of bias evaluation for the included studies were summarized in Additional file 1: Tables S2 and S3. The overall risk of bias was low.
Trajectory of weight change after discontinuation of AOMs
Overall
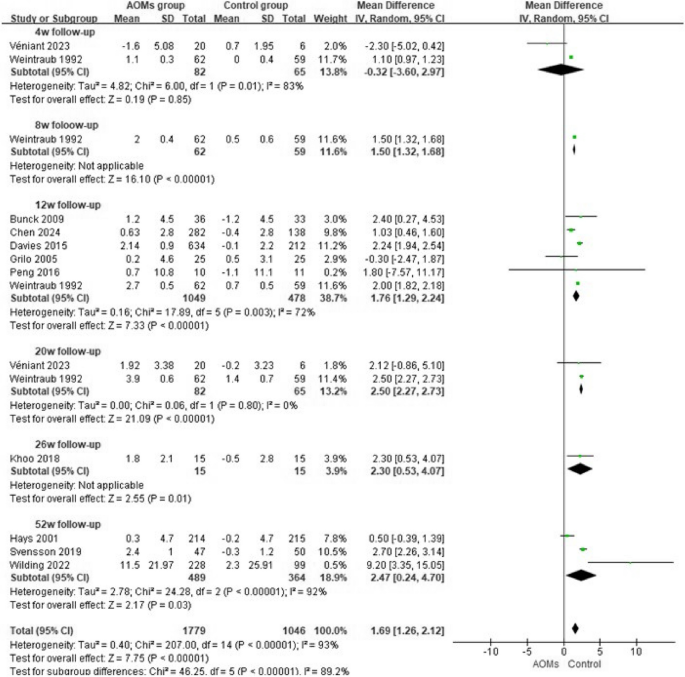
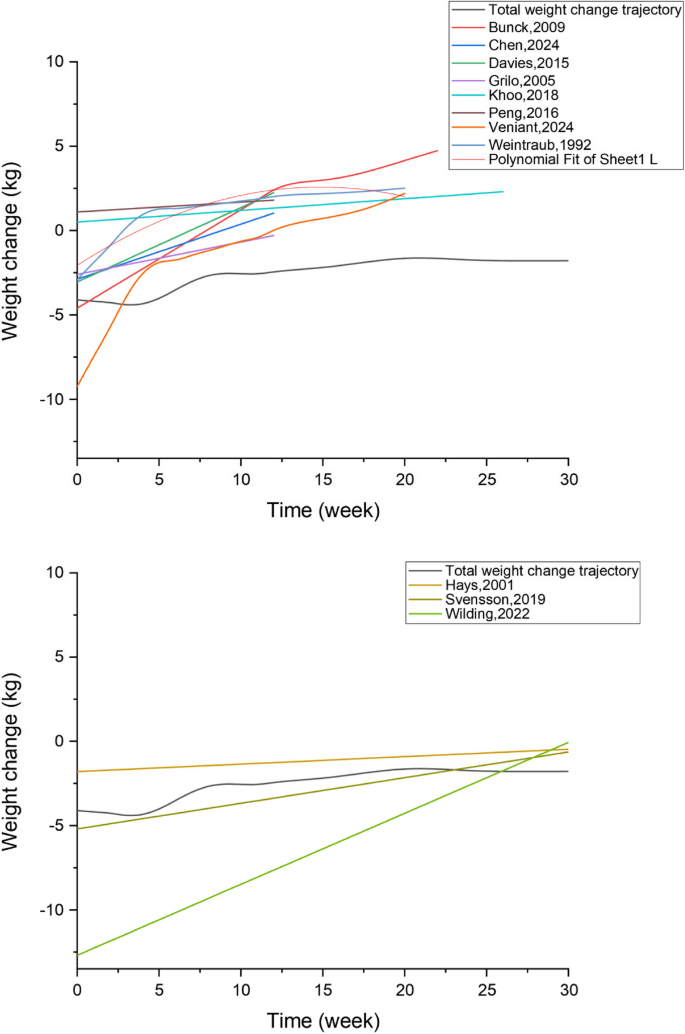
Overall, compared with control groups, AOM treatment was significantly associated with greater weight regain which varied according to follow-up time point after treatment discontinuation (Fig. 1; Additional file 2: Fig. S2). At week 4, compared with control groups, AOM treatment still resulted in 0.32 kg (95% CI − 3.60 to 2.97, P = 0.85, Ι2 = 83%) weight loss, while at weeks 8, 12, 20, 26, and 52, AOMs were associated with significant weight regain when compared with controls (WMD = 1.50 kg, 95% CI 1.32 to 1.68, P < 0.0001, Ι2 = 0.0%; WMD = 1.76 kg, 95% CI 1.29 to 2.24, P < 0.0001, Ι2 = 72.0%; WMD = 2.50 kg, 95% CI 2.27 to 2.73, P < 0.0001, Ι2 = 0.0%; WMD = 2.30 kg, 95% CI 0.53 to 4.07, P = 0.01, Ι2 = 0.0%; WMD = 2.47 kg, 95% CI 0.24 to 4.70, P = 0.03, Ι2 = 92.0%, respectively). Figure 2 shows the weight regain trajectory at different follow-up time points after treatment discontinuation. It can be seen from the figure that the weight had significantly regained in 8 weeks after treatment discontinuation, and showed a rising trend within 12 weeks and 20 weeks after treatment discontinuation, and then the weight regain gradually stabilized. Weight loss persisted 52 weeks after discontinuation of AOMs, as compared with baseline.
Stratified by baseline weight or BMI
Subgroup analyses were performed bounded by the weighted median of baseline weight (105.6 kg). Significant weight regain was observed in both subgroups (WMD = 1.45 kg, 95% CI 0.62 to 2.28, P = 0.006, I2 = 72%; WMD = 2.24 kg, 95% CI 1.94 to 2.54, P < 0.001, I2 = 0.0%), but no significant difference was observed between the two subgroups.
In the subgroup analyses that used a BMI cutoff of 35 kg/m2, significant weight regain was only observed in the subgroup with lower BMI when compared to the control group (WMD = 1.66 kg, 95% CI 0.87 to 2.44, P < 0.001, I2 = 71%). Contrary to common knowledge, patients in the subgroup with a higher BMI did not show significant weight gain (WMD = 1.21 kg, 95% CI − 1.24 to 3.60, P = 0.33, I2 = 72%) and there were no significant differences between the subgroups (P = 0.73) (Additional file 2: Fig. S3).
Stratified by placebo control or active control
Considering the RCTs including placebo and active control, we performed a subgroup analysis between them. When combined placebo controlled studies as a whole, significant weight regain was observed when compared with placebo group (WMD = 1.72 kg, 95% CI 1.20 to 2.23, P < 0.001, I2 = 83%). The same result was obtained in the active controlled studies (WMD = 2.37 kg, 95% CI 0.30 to 4.44, P = 0.02, I2 = 0%), while there is no statistically significant distinction observed between the two subgroups (P = 0.55) (Additional file 2: Fig. S3).
Stratified by different indications
For indication of obesity alone, AOMs resulted in 1.31 kg (95% CI 0.38 to 2.24, P = 0.006, I2 = 73%) weight regain compared with control groups. With indication of diabetes, AOMs resulted in 2.24 kg (95% CI 1.94 to 2.54, P < 0.001, I2 = 0%) weight change compared with control groups. There were no statistically significant differences observed between the two subgroups (P = 0.06) (Additional file 2: Fig. S3).
Stratified by GLP-1 related and non GLP-1 related treatments
In the included RCTs, GLP-1 related drugs (including liraglutide, semaglutide, beinaglutide, exenatide, and AMG133) showed significant weight regain compared with control group (WMD = 1.78 kg, 95% CI 0.76 to 2.80, P = 0.006, I2 = 85%). Regarding to the non GLP-1 related weight management strategies, no significant weight regain was observed (WMD = 1.23 kg, 95% CI − 0.58 to 3.04, P = 0.18, I2 = 53%). There was no significant difference in weight regain between the two groups (P = 0.61) (Additional file 2: Fig. S3).
Stratified by lifestyle intervention
Continuation of lifestyle interventions after treatment discontinuation may affect the extent of weight regain. In the study, the subgroup with continuous lifestyle intervention showed significant weight regain (WMD = 1.83 kg, 95% CI 1.36 to 2.31, P < 0.001, I2 = 85%), whereas the subgroup without continuous lifestyle intervention did not (WMD = 1.1 kg, 95% CI − 0.99 to 3.19, P = 0.30, I2 = 34%) (Additional file 2: Fig. S3).
Stratified by the level of weight reduction
To explore the relationship between significant weight loss during treatment and long-term weight loss maintenance, we performed subgroup analyses of whether significant weight loss was associated with weight regain. RCTs that showed significant weight loss during treatment periods compared with the control group and studies that did not show significant weight loss were divided into two subgroups. Compared to the control group, only the subgroup with significant weight loss during treatment periods demonstrated a substantial regain in weight (WMD = 1.76 kg, 95% CI 1.27 to 2.24, P < 0.001, I2 = 78%). The results suggested that at week 12 after treatment discontinuation, there was no significant difference in weight regain between significant and not significant weight loss subgroup (P = 0.99) (Additional file 2: Fig. S3).
Stratified by the rate of weight reduction
When subgroups were grouped by weighted median of the rate of weight reduction, significant weight regain was observed in both the faster and slower subgroups compared with the control group (WMD = 1.94 kg, 95% CI 1.62 to 2.20, P < 0.001, I2 = 83%; WMD = 2.0 kg, 95% CI 1.83 to 2.18, P < 0.001, I2 = 0%, respectively). However, there were no significant differences between two groups (P = 0.69).
Trajectory of BMI change after discontinuation of AOMs
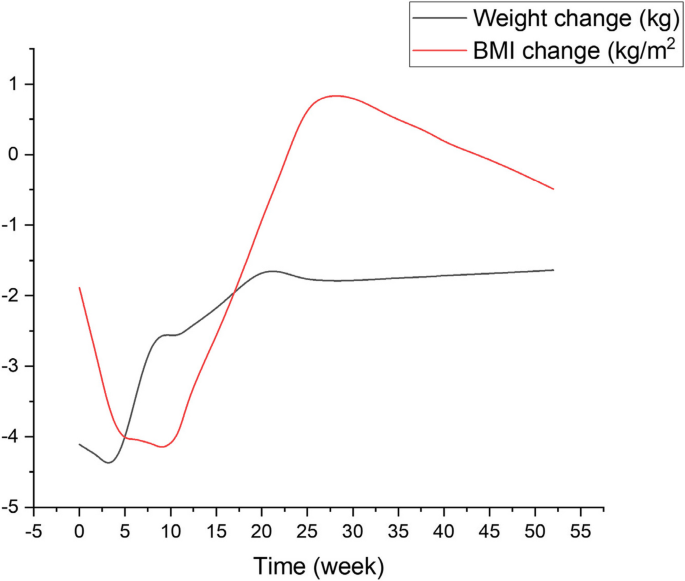
Regarding to BMI change, it was also different at specific follow-up time points after treatment discontinuation. BMI loss continued after treatment discontinuation of weeks 4 and 10 (WMD = − 1.77 kg/m2, 95% CI − 2.73 to − 0.81, P < 0.001, I2 = 0.0%; WMD = − 0.21 kg/m2, 95% CI − 1.31 to 0.88, P = 0.7, I2 = 0.0%). At weeks 26 and 52, BMI regain was 0.70 kg/m2 (95% CI 0.36 to 1.04, P < 0.0001, I2 = 0%) and 0.82 (95% CI 0.66 to 0.98, P < 0.0001, I2 = 83%), respectively. There was a turning point in BMI change trajectory at different follow-up time points after treatment discontinuation (Fig. 3).
Association between participant characteristics and weight change
Results of meta-regression indicated that the difference between participants including sex, age, indication, and BMI was not associated with the risk of weight regain, and the same is true of different control group. Meanwhile, the difference between treatment and follow-up duration was also not related to the weight regain and the level and rate of weight reduction did not either (Additional file 1: Table S4).
Source link


