Spatial and cellular landscape of early human cardiogenesis
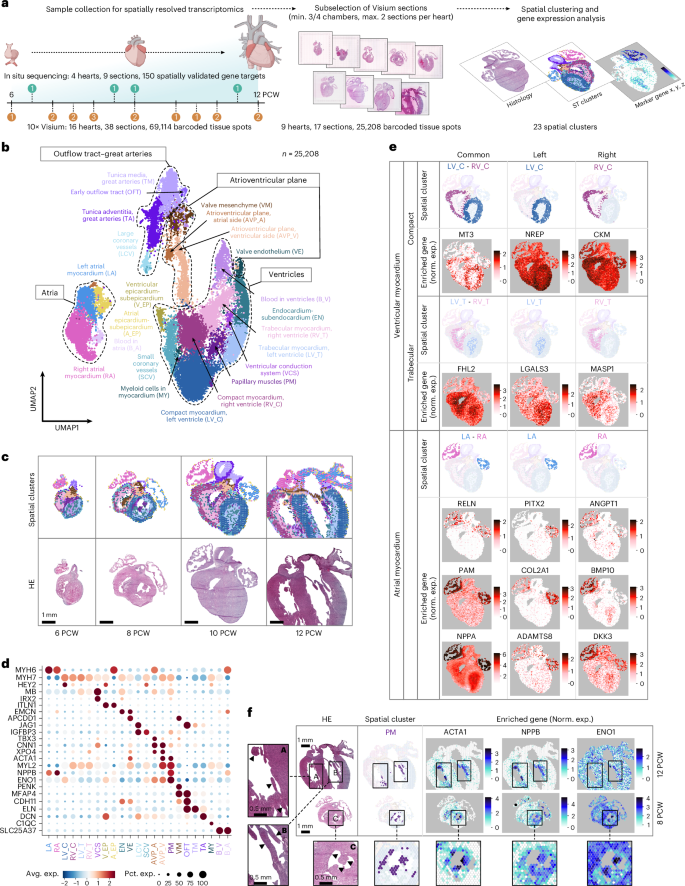
To create a comprehensive account of spatial molecular patterns during early cardiogenesis, we performed 10× Genomics Visium spatial transcriptomics analysis on 16 hearts between PCWs 6 and 12, complemented by ISS of 150 selected transcripts in 4 additional hearts. We compiled a dataset of 69,114 tissue spots from 38 heart sections, covering all major structural components of the developing organ (Fig. 1a). To investigate the molecular determinants of regionality, we selected 17 sections encompassing at least three cardiac chambers and performed unsupervised clustering of the corresponding 25,208 tissue spots, resulting in 23 temporally largely consistent spatial clusters with different transcriptomic profiles (Fig. 1a–d, Extended Data Fig. 1a–e, Supplementary Discussion 1 and Supplementary Table 1). This analysis highlighted side-specifically enriched markers of major myocardial compartments and a stress-related molecular signature in the papillary muscles (Fig. 1e,f and Supplementary Discussion 1), further supported by an independent, neighborhood-based region identification approach34 (Supplementary Fig. 1a–e and Supplementary Discussion 1). Moreover, non-negative matrix factorization on the entire Visium dataset delineated 20 spatial gene modules, available in our online viewer.
a, Overview of spatially resolved transcriptomic dataset generation, with donor numbers by PCW indicated in orange (Visium) and green (ISS) circles. b, The 23 spatial clusters of the developing heart, corresponding to major cardiac structural components (dashed lines). UMAP, uniform manifold approximation and projection. c, Temporal evolution of spatial cluster distribution, presented in 6, 8, 10 and 12 PCW heart sections. HE, hematoxylin & eosin. d, Relative enrichment of consensus cell type markers and selected differentially expressed genes (DEGs) (log2FC > 0, P < 0.05) across the 23 spatial clusters. Avg. exp., average expression; Pct. exp., percent of expressing cells; FC, fold change. e, Spatial feature plots displaying side-specific enrichment of selected DEGs of the left (LV_C) and right (RV_C) compact, left (LV_T) and right (RV_T) trabecular and left (LA) and right (RA) atrial myocardial spatial clusters in a 10 PCW heart section. f, Spatial feature plots illustrating stress-related gene signature in papillary muscles (arrowheads in ROIs A–C), featuring selected DEGs of the corresponding spatial cluster (PM).
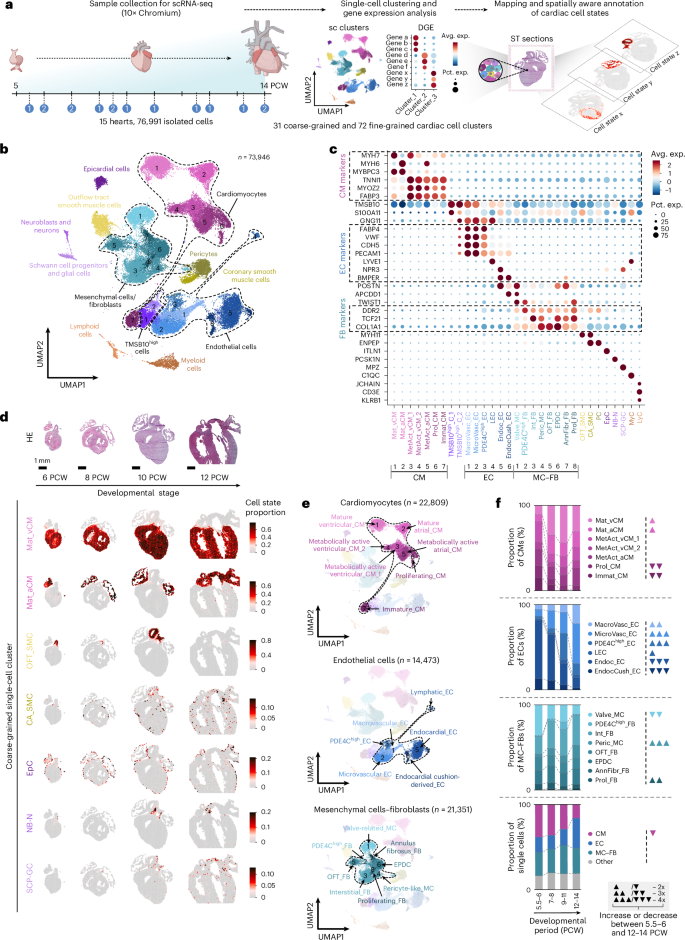
Next, we explored the cellular composition of the developing heart tissue by generating a scRNA-seq dataset from 15 hearts between PCWs 5.5 and 14, using the 10× Genomics Chromium platform. Unsupervised clustering of the 76,991 high-quality cardiac cells defined 31 coarse-grained and 72 fine-grained cell states with distinct transcriptomic profiles (Supplementary Fig. 2a and Supplementary Tables 2–6), creating a common framework for downstream analysis throughout the investigated period. We deconvolved the spatial transcriptomics dataset with these clusters to map their positions within heart sections, informing a spatially aware cell state annotation strategy (Fig. 2a). The predicted spatial localization, expression of canonical cell type markers and exploration of differentially expressed gene profiles enabled the identification of major populations of cardiomyocytes (CMs), endothelial cells (ECs) and non-mural MCs and FBs, along with less abundant populations of neuroblasts and neurons (NB-N), and Schwann cell progenitors and glial cells (SCP-GC), further explored by fine-grained clustering, in addition to other core cardiac cell types (Fig. 2b–d, Extended Data Fig. 2a–c, Supplementary Fig. 2a and Supplementary Table 2). Temporal changes in coarse-grained cluster distribution corresponded to key early cardiogenesis events (Fig. 2e,f, Supplementary Fig. 2b and Supplementary Discussion 1). We also identified and characterized mural cells, such as pericytes (PC) and two spatially distinct smooth muscle cell populations (OFT_SMC and CA_SMC) (Supplementary Fig. 3a–f and Supplementary Discussion 1), in addition to two clusters (TMSB10high_C_1–2) enriched in thymosin transcripts, previously implicated in coronary vessel development20,35. Furthermore, we detected myeloid (MyC) and lymphoid cell (LyC) populations, along with two red blood cell-dominant clusters that were excluded from downstream analysis (Supplementary Fig. 4a–e and Supplementary Discussion 1), and identified an epicardial cell (EpC) population (Supplementary Fig. 5a–e and Supplementary Discussion 1).
a, Overview of Chromium single-cell dataset generation and spatially informed annotation of cardiac cell states, with donor numbers by PCW shown in blue circles. DGE, differential gene expression. b, UMAP representing 31 coarse-grained cardiac single-cell clusters, corresponding to 11 main cell types, including CMs, ECs and non-mural MC–FBs (dashed lines). c, Enrichment of canonical cell type markers across coarse-grained single-cell clusters. Dashed rectangles highlight consensus markers of CMs, ECs and FBs. d, Spatiotemporal mapping of selected coarse-grained clusters in 6, 8, 10 and 12 PCW heart sections. e, Spatially aware annotation of coarse-grained CM, EC and MC–FB clusters. f, Temporal changes in coarse-grained cluster proportions in the CM, EC and MC–FB subsets across four developmental age groups (5.5–6, 7–8, 9–11 and 12–14 PCW). ▲2×, ▲▲3×, ▲▲▲4× increase; ▼2×, ▼▼3×, ▼▼▼4× decrease between the 5.5–6 and 12–14 PCW age groups.
We observed previously unappreciated molecular transitions within the EC and non-mural MC–FB populations (Supplementary Fig. 6a–c and Supplementary Discussion 1) and spatiotemporal patterns in the region of the great arteries and cardiac valves (Supplementary Fig. 7a–c and Supplementary Discussion 1). Enrichment analysis of heart-disease-associated gene panels further confirmed our cluster annotations and highlighted early and widespread expression of genetic determinants in various cardiac pathologies (Supplementary Fig. 8a,b).
Molecular map of the developing pacemaker-conduction system
CMs are the fundamental contractile units of the myocardium, yet their coordination relies on specialized cells of the CPCS, enabling intrinsic automaticity and timely electrical impulse propagation. Molecular characteristics of CPCS cells, previously explored in animal models36,37,38,39,40,41 and adult human hearts42, remain uncharted during human development.
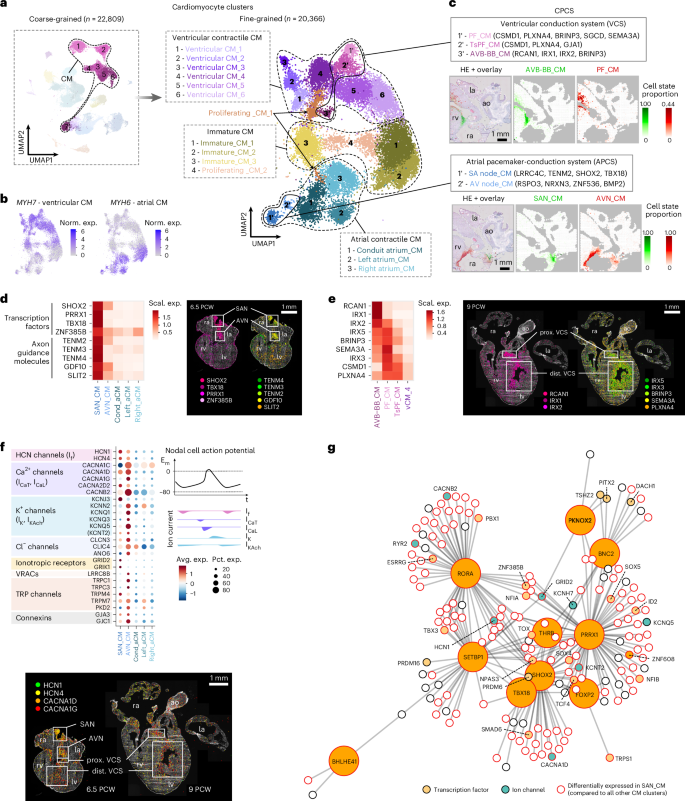
Here, we identified 19 distinct cell states through fine-grained clustering of the CM population, confirming its high transcriptional diversity43 (Fig. 3a,b, Extended Data Fig. 3a,b and Supplementary Table 3). Among these, we observed clusters with robust expression of previously described CPCS markers36,37,38,39,40,41,42. Spatial mapping traced these clusters to tissue regions consistent with the position of the sinoatrial node (SAN_CM), atrioventricular node (AVN_CM), atrioventricular bundle and bundle branches (AVB-BB_CM) and Purkinje fibers (PF_CM) (Fig. 3c). Notably, we observed an additional ventricular cluster with shared transcriptional characteristics and close spatial association with PF_CMs, presumably representing transitional PFs (TsPF_CM) (Extended Data Fig. 3c).
a, UMAPs displaying seven coarse-grained and 19 fine-grained CM clusters, representing a range of contractile CMs of ventricular (vCM_1–6) and atrial origins (Left_aCM, Right_aCM and Cond_aCM aligning with smooth-walled conduit atrial regions), cell states of lower maturation levels (Immat_CM_1–3) and with cell cycle signature (Prol_CM_1–2) as well as components of the CPCS. b, Feature plots of MYH7 and MYH6 outlining ventricular and atrial identities, respectively. c, CM components of the CPCS with characteristic markers and predicted localization in an 11 PCW heart section. d, Heatmap visualizing per-gene scaled expression of transcription factors and axon guidance molecules in SAN_CMs and AVN_CMs, and mature contractile atrial CM populations (left). Spatial enrichment of these genes in sinoatrial and atrioventricular node regions is presented in a 6.5 PCW heart section by ISS (right). e, Heatmap illustrating per-gene scaled expression of CPCS marker genes in AVN-BB_CMs, PF_CMs, TsPF_CMs and vCM_4 cells, characterized by the highest maturation state among contractile ventricular CM clusters (left). Spatial expression patterns of these genes detected by ISS in a 9 PCW heart section, corroborating their association with the proximal and distal ventricular conduction system (VCS) (right). f, Dot plot featuring relative expression of selected ion channels in SAN_CMs and AVN_CMs compared to contractile atrial CM clusters (upper left). Illustration of ion currents of the nodal cell action potential (upper right). Spatial pattern of HCN and T-type Ca2+ channel transcripts in 6.5 PCW and 9 PCW heart sections, detected by ISS (lower). g, Gene regulatory network of SAN_CMs, including the top ten differentially expressed transcription factors compared to all other CM states and their associated target genes. la, left atrium; ra, right atrium; rv, right ventricle; ao, aorta; If, funny current; ICaT, T-type calcium current; ICaL, L-type calcium current; IK, delayed rectifier potassium current; IKACh, acetylcholine-activated potassium current.
CPCS CMs displayed substantial transcriptomic overlaps. SAN_CMs and AVN_CMs expressed transcription factors (SHOX2, TBX18, PRRX1, ZNF385B) specifically or strongly enriched in pacemaker cells, as well as axon guidance molecules (TENM2, TENM3, TENM4, GDF10, SLIT2), outlining the nodes as essential targets of the developing cardiac innervation (Fig. 3d and Supplementary Fig. 9a,c). We also found the axon guidance molecule partner LRRC4C, not yet discussed in the context of the CPCS, specifically expressed in SAN_CMs (Extended Data Fig. 3a). Genes highly enriched in AVN_CMs reflected the node’s position in the atrioventricular plane (BMP2, RSPO3, ADAMTS19) and neuronal features of these cells (NRXN3, ZNF536) (Supplementary Table 3). PF_CMs expressed several characteristic markers (CSMD1, BRINP3, SGCD, NTN1, SEMA3A), partly shared with TsPF_CMs (Fig. 3e, Supplementary Fig. 9b,c). Although the recently described atrioventricular bundle markers CNTN5 and CRNDE42 were more widely distributed in our dataset, several genes enriched in AVB-BB_CMs (RCAN1, HS3ST3A1) were specifically concentrated at the upper edge of the ventricular septum, probably marking this structure (Fig. 3e, Extended Data Fig. 3d and Supplementary Fig. 9b). Interestingly, the vCM_1 cluster showed the highest CNTN5 expression and shared enriched genes with both CPCS (TBX3, HS3ST3A1, BRINP3, TENM3) and contractile vCM states (PRDM16, NLGN1, SORBS2, MYL2) (Supplementary Table 3). Furthermore, its transcriptomic profile (XPO4, MYL2, TNFRSF19, SORBS2, ZFP36L1) and predicted localization in valve roots and the atrioventricular region matched the elusive AVP_V spatial cluster (Extended Data Fig. 3b,e and Supplementary Tables 1 and 3), suggesting a transitional identity probably contributing to atrioventricular conductive tissue formation, as previously described in mice38.
Electrophysiological properties of CPCS components are shaped by their ion channel repertoire44 (Fig. 3f and Extended Data Fig. 3f), as recently explored in the adult human heart42. In our dataset, developmental SAN_CMs and AVN_CMs featured ion channel profiles typical of nodal cells, with marked enrichment of hyperpolarization-activated cation channels (HCN1, HCN4) and several L-type and T-type calcium channel genes (CACNA1C, CACNA1D, CACNA1G, CACNA2D2, CACNB2), all contributing to the depolarization phase of the nodal action potential. Unlike in adults, CACNA1G was most enriched in AVN_CMs, while SAN_CMs and ventricular CPCS cell states displayed lower expression. CM repolarization, primarily driven by potassium channels, also showed cell-type-specific patterns. SAN_CMs highly expressed the G-protein-coupled inwardly rectifying potassium channel subunit KCNJ3 (but not KCNJ5), a known marker of adult PF cells, absent in the developmental equivalents in our dataset. By contrast, PF_CMs were enriched in KCNJ2 and KCNH7. AVN_CMs showed high levels of KCNQ1, previously associated with atrioventricular block45,46, as well as ion channel subunits shared with contractile CMs (for example, CACNA1C, KCNQ3, KCNQ5), suggesting a hybrid electrophysiological profile. Although KCND2 and the functionally related KCND3, enriched in the adult atrioventricular bundle42, showed low expression in our dataset, their known interactor KCNIP4 was highly enriched in vCM_1 cells, further supporting the plausible role of this cell state in the development of atrioventricular conductive tissue (Extended Data Fig. 3a). Gap junction genes followed adult-like patterns, with the low-conductance Cx45 (GJC1) enriched in SAN_CMs and AVN_CMs, and high-conductance Cx40 (GJA5) marking PF_CMs42.
In addition to several chloride, volume-regulated anion and transient receptor potential channels with as-yet unclear relevance in CPCS function, we also observed enrichment of several ionotropic glutamate receptor genes (GRID2, GRIK1) in SAN_CMs, supporting a glutamatergic signaling machinery proposed in the adult node42, and the GABA receptor ion channel GABRB2 gene in PFs, specific to the developmental phase (Fig. 3f and Extended Data Fig. 3f).
To investigate the molecular drivers of pacemaker phenotype specification, we inferred a gene regulatory network of SAN_CMs (Fig. 3g). Key transcription factors (SHOX2, PRDM6, THRB, FOXP2) and ion channel targets (HCN1, CACNA1D, KCNT2, CACNB2) showed substantial overlap with a recent analysis of adult SAN_CMs42. Other known pacemaker regulators enriched in SAN_CMs included TBX18, BNC2 and TBX3, with the latter exhibiting markedly higher expression in AVN_CMs, AVB-BB_CMs and vCM_1 cells (Supplementary Table 3). TBX3 suppresses the atrial contractile gene program; thus, its broader expression in CPCS components aligns with their progressive fate restriction, previously described in mouse47,48. Notably, the SAN_CM regulatory network also included the transcription factors BHLHE41 and RORA, regulators of the mammalian circadian clock, which were proposed to underlie time-of-day variation in arrhythmia susceptibility49,50.
Formation of the cardiac innervation and chromaffin cells
Cardiac function is tightly regulated by sympathetic and parasympathetic signals from the autonomic nervous system, transmitted by the intracardiac ganglionated plexi. Cells of this structure originate from the cardiac neural crest, but their developmental pathway in humans remains unclear51.
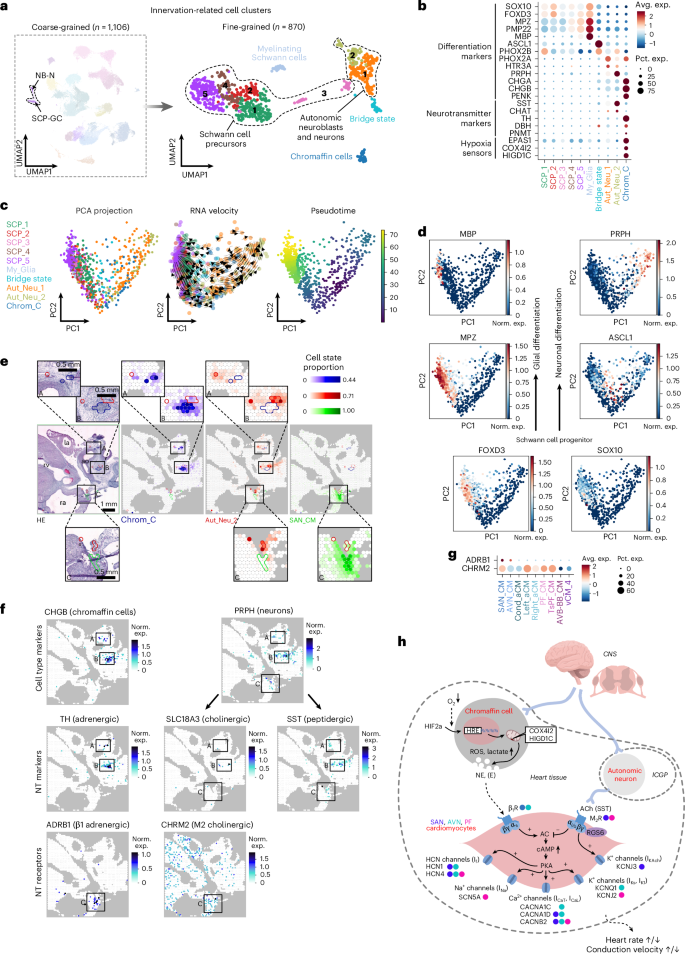
To explore the formation of early cardiac innervation, we reclustered the coarse-grained NB-N and SCP-GC populations into ten fine-grained clusters, including five SCP (SOX10, FOXD3), a myelinating Schwann cell (My_SC; MPZ, PMP22, MBP), an intermediate bridge state (ASCL1), two autonomic neuroblast-neuron clusters (Aut_Neu_1-2; PRPH, STMN2) and, notably, a cluster enriched in CHGA, CHGB and PENK, marking a local neuroendocrine chromaffin cell population (Chrom_C) (Fig. 4a,b, Extended Data Fig. 4a, Supplementary Fig. 10 and Supplementary Table 4). In line with the essential role of chromaffin cells in hypoxia response, cardiac Chrom_Cs showed robust expression of molecular hypoxia sensors, such as EPAS1 (encoding HIF2α), COX4I2 and HIGD1C, recently described in the oxygen-sensing machinery of the carotid body52 (Fig. 4b). To our knowledge, this is the first in situ observation of intracardiac chromaffin cells in the developing heart, as they are absent in the mouse model and thus appear to be a human-specific cardiac feature. RNA velocity and pseudotime analyses confirmed a fork-like transition from early SCPs towards two parallel trajectories of neuronal-chromaffin and glial cell lineages (Fig. 4c,d and Supplementary Fig. 10).
a, UMAPs showing the NB_N and SCP-GC coarse-grained and ten fine-grained clusters related to the cardiac autonomic innervation. b, Dot plot illustrating the relative expression of glial, neuronal and chromaffin cell differentiation markers, neurotransmitter-related genes and components of the acute oxygen-sensing machinery across all fine-grained innervation-related cell clusters. c, RNA velocity and pseudotime analysis revealing two parallel developmental trajectories among innervation-related cell clusters. d, Expression of glial and neuronal differentiation markers. e, Spatial mapping of Chrom_Cs (blue), Aut_Neu_2 cells (red) and SAN_CMs (green) in an 11 PCW heart section, outlining their neighboring compartments in the adventitia of the great vessels (ROIs A and B), and an Aut_Neu_2 subset in proximity to the sinoatrial node (ROI C). la, left atrium; ra, right atrium; rv, right ventricle; ao, aorta. f, Spatial feature plots of neurotransmitter (NT) metabolism-related genes and receptors in the same section with ROIs A–C in consistent positions to panel e. g, Dot plot presenting enrichment of β1 adrenergic and M2 cholinergic receptor transcripts in pacemaker-conduction system CMs. h, Proposed model of autonomic control of fetal heart function. Blue, green and pink dots beside the displayed genes represent relative enrichment in SAN_CMs, AVN_CMs and PF_CMs, respectively, in comparison to relevant contractile CM states displayed in Fig. 3f and Extended Data Fig. 3f. ICGP, intracardiac ganglionated plexi; CNS, central nervous system; ROS, reactive oxygen species.
Chrom_Cs and Aut_Neu_2 cells occupied nearby but distinct regions in the atria and adventitia of great arteries, reflecting their common origin but divergent roles (Fig. 4e and Extended Data Fig. 4b). Meanwhile, Aut_Neu_2-enriched areas near SAN_CMs probably represent neurons that directly innervate the nodal tissue (Fig. 4e). Most SCP states appeared dispersed, except for SCP_5 cells and My_SCs, which concentrated around nerve structures (Extended Data Fig. 4c).
We identified somatostatin (SST) as the main neurotransmitter gene expressed in the Aut_Neu_1 and Aut_Neu_2 populations, with cholinergic marker CHAT present in a smaller proportion of these cells (Fig. 4b,f). Meanwhile, Chrom_Cs strongly expressed TH, and to a lower extent in DBH and PNMT, encoding key enzymes of catecholamine synthesis (Fig. 4b,f). This indicates that developing intracardiac ganglionated plexi neurons primarily use peptidergic and, to a lesser degree, cholinergic transmission, while local chromaffin cells are the main source of norepinephrine (and to a lesser extent, epinephrine) in the early fetal heart tissue.
Interestingly, we found negligible expression of somatostatin receptors in our datasets; meanwhile, β1 adrenergic receptor (ADRB1) was strongly enriched in SAN_CMs and AVN_CMs, and M2 acetylcholine receptor (CHRM2) was more broadly expressed across CPCS CMs (Fig. 4f,g). A modified ligand–receptor score, calculated between the Chrom_C, Aut_Neu_2 and SAN_CM states based on coordinated expression levels of key enzymes (TH and CHAT) and receptors (ADRB1 and CHRM2), reaffirmed distinct sources of adrenergic and cholinergic mediation of sinoatrial node function (Extended Data Fig. 4d).
Additionally, several genes regulating neuronal migration, neurite growth and synapse formation were enriched in SAN_CMs, AVN_CMs, Aut_Neu_1 and Aut_Neu_2 populations (Extended Data Fig. 4e,f). Cell–cell communication analysis between ligands and receptors specifically enriched in SAN_CMs and Aut_Neu_2 cells highlighted the PTPRS–NTRK3 and TENM2–ADGRL1 pairs, known for excitatory synapse organization53 and axon guidance in the central nervous system54, respectively (Extended Data Fig. 4g). These putative interactions might also be relevant for establishing precise connections between the developing cardiac innervation and pacemaker cells.
Based on these insights, we propose that in the early fetal heart, parasympathetic signals are transmitted by local neurons, while sympathetic modulation is mediated by resident chromaffin cells through paracrine signaling in response to tissue hypoxia. These interactions probably modulate ion channels in CPCS CMs to adapt heart rate and conduction velocity to environmental conditions (Fig. 4h). Furthermore, the presence of intracardiac chromaffin cells may also explain the origin of rare cardiac pheochromocytomas55.
Endothelial states in endocardial cushion-derived structures
Cardiac ECs can be divided into vascular and endocardial subsets. The former rapidly expands and diversifies with the swift growth of coronary vessels during the first trimester, while the latter gives rise to endocardial cushions, contributing to the subsequent formation of cardiac valves, atrial septum and the upper membranous septum of the ventricles. Although the major cardiac EC populations were recently characterized in the fetal human heart28, we still lack a transcriptome-wide description of the scarce endocardial cushion-related ECs and their various derivatives23,56.
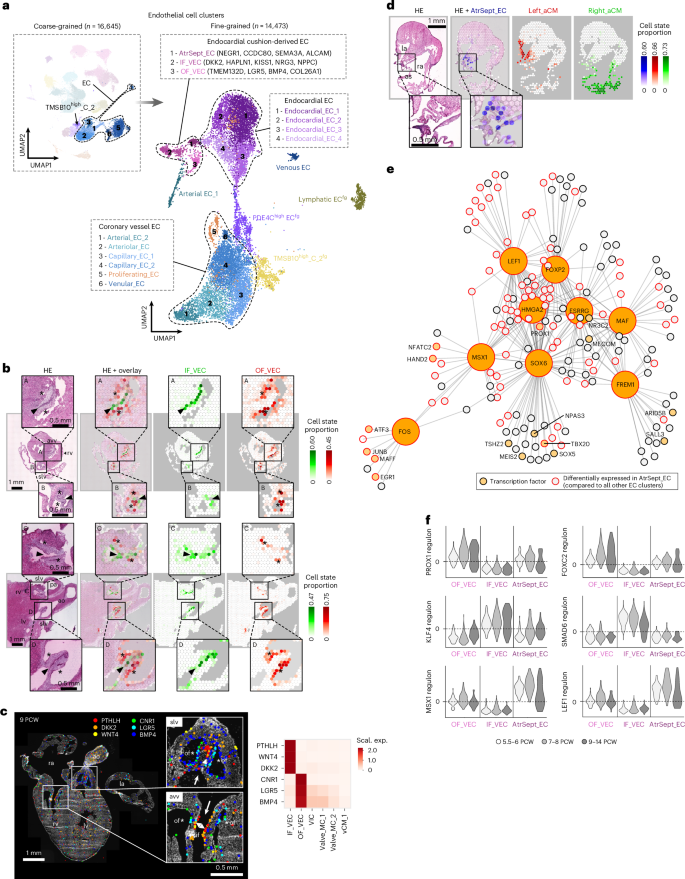
In the merged coarse-grained EC and TMSB10high_C_2 clusters, we defined 18 fine-grained cell states (Fig. 5a, Extended Data Fig. 5a–c and Supplementary Table 5), encompassing diverse EC populations from the great arteries and coronary vasculature (Supplementary Fig. 11a,b) and the endocardial lining (Supplementary Fig. 11c). We also observed three clusters with common enrichment of endothelial–mesenchymal transition regulators central to endocardial cushion formation (NFATC1, APCDD1, TWIST1) but also featuring largely distinct transcriptional profiles (Extended Data Fig. 5a,d,e and Supplementary Table 5). Spatial mapping traced two of these cell states to opposite sides of the developing heart valves, outlining inflow and outflow valve ECs (IF_VEC and OF_VECs, respectively) consistently in the atrioventricular and semilunar valves already from PCW 6, suggesting their early specification (Fig. 5b, Extended Data Fig. 5f and Supplementary Fig. 11d). Highly enriched genes of IF_VECs included components of the WNT signaling axis (WNT2, WNT4, WNT9B, DKK2, PTHLH), with several of them displaying spatial enrichment in the coaptation zone of the valves (Fig. 5c). OF_VECs featured high expression of BMP ligands (BMP4, BMP6), WNT signaling modulators (LGR5) and the endocannabinoid receptor CNR1, with strong spatial enrichment on the fibrosa side of the semilunar valves and moderate enrichment on the ventricular side of the atrioventricular valves (Fig. 5c). Meanwhile, the third cluster exhibited highly distinct spatial localization within the atrial septum (AtrSept_EC), marking a previously uncharacterized cardiac EC state (Fig. 5d and Extended Data Fig. 5g). In addition to more specific markers (NEGR1, ALCAM, SEMA3A, CCDC80, MSX1), AtrSept_ECs shared several strongly enriched genes (LRRC4C, LSAMP, OPCML) with an endocardial population (Endoc_EC_4) which delineates the smooth-walled atrium (Extended Data Fig. 5a,e,g and Supplementary Table 5).
a, UMAPs displaying six coarse-grained EC clusters and the TMSB10high_C_2 clusters, divided into 18 fine-grained cell states representing endocardial (Endoc_EC_1–4) and endocardial cushion-related cells (OF_VEC, IF_VEC, AtrSept_EC), endothelium of great arteries and large veins (Atr_EC_1, Ven_EC) and consecutive segments of the coronary vasculature, including arterial (Art_EC_2), arteriolar (Arteriol_EC), capillary (Cap_EC_1–2) and venular (Venul_EC) endothelial cells. Additionally, proliferating (Prol_EC) and lymphatic endothelial cells (LECfg), and refined populations of thymosin-enriched (TMSB10high_C_2fg) and PDE4C-enriched endothelial cells (PDE4Chigh_ECfg) are also present. b, Spatial mapping of IF_VECs (green) and OF_VECs (red) to opposite sides of the atrioventricular (ROI A) and semilunar valves (ROIs B–D), presented in 8 PCW (upper) and 12 PCW (lower) heart sections. c, Side-specific spatial enrichment of selected IF_VEC and OF_VEC markers in atrioventricular and semilunar valves in a 9 PCW heart section detected by ISS (left). White arrows mark the direction of blood flow. Heatmap displaying per-gene scaled expression of the same genes across EC, MC and CM states enriched in the valves (outlined in Fig. 7d) (right). d, Spatial mapping of AtrSept_ECs (blue) to the atrial septum between Right_aCM-dominated (green) and Left_aCM-dominated (red) areas in an 8 PCW heart section. e, Gene regulatory network of AtrSept_ECs, including transcription factors enriched compared to IF_VECs and OF_VECs, and their associated target genes. f, Violin plots illustrating regulon enrichment of selected transcription factors in AtrSept_ECs, IF_VECs and OF_VECs across three age groups (5.5–6, 7–8 and 9–14 PCW). slv, semilunar valve; avv, atrioventricular valve; lv, left ventricle; pa, pulmonary artery; as, atrial septum; arrowhead or if, inflow side of valve; asterisk or of, outflow side of valve.
Gene regulatory network and regulon enrichment analysis illuminated further molecular differences between these three cell states (Fig. 5e,f). We identified MSX1 and LEF1—known endothelial–mesenchymal transition mediators during endocardial cushion formation that were recently detected in mouse atrial septum57,58 and implicated in human atrial septal defects58,59,60,61—as the most highly enriched transcription factors in AtrSept_ECs. In OF_VECs, we found enrichment of PROX1 and FOXC2 transcription factors, known to act in concert in response to oscillatory shear stress, maintaining extracellular matrix structure and preventing myxomatous degeneration of cardiac valves62. Several transcription factors enriched in IF_VECs have an established role in modulating WNT signaling, including KLF4 and SMAD6, which are known transducers of laminar shear stress in ECs63,64. Importantly, we observed pronounced differences in the regulon enrichment of these transcription factors between IF_VECs and OF_VECs from as early on as PCW 5.5–6, suggesting that hemodynamic forces are core factors in VEC diversification already in the embryonic period.
Spatial heterogeneity of developmental cardiac FBs
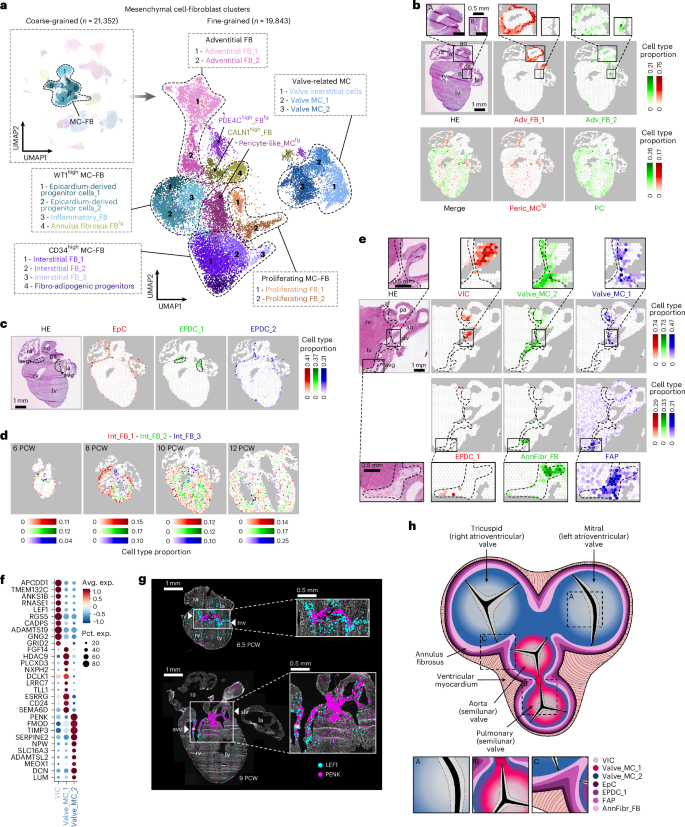
FBs and MCs constitute an ambiguous subset of developmental heart cells owing to their pronounced transcriptional heterogeneity and lack of well-established molecular markers. Spatial factors, reflecting the positions of their progenitors and niche-related environmental signals, have a central role in defining cellular identities in this population65. To explore this topological diversity, we spatially mapped 18 fine-grained cardiac FB and MC clusters (Fig. 6a, Extended Data Fig. 6a,b, Supplementary Table 6 and Supplementary Discussion 1) to characteristic tissue locations, including the adventitia of great arteries and coronary arteries (Fig. 6b), the subepicardium (Fig. 6c) and the myocardium (Fig. 6d). Notably, we identified a cell state with a marker profile resembling fibro-adipogenic progenitors in the atrioventricular sulcus and the myocardium, with potential implications for epicardial fat formation and the pathogenesis of arrhythmogenic right ventricular dysplasia (Fig. 6e, Extended Data Fig. 6a,c–e and Supplementary Discussion 1).
a, UMAPs displaying eight coarse-grained and 18 fine-grained FB and MC clusters, representing WT1-enriched and CD34-enriched, adventitial, valve-related and proliferating subsets, along with additional CALN1-enriched (CALN1high_FB) and refined pericyte-like (Peric_MCfg) and PDE4C-enriched populations (PDE4Chigh_FBfg). b, Spatial mapping of Adv_FB_1 (red) and Adv_FB_2 (green) cells to the great arteries (ROI A) and coronary arteries (ROI B), respectively (upper), and Peric_MCfg cells (red) and pericytes (PC) (green) to complementary positions in the atrial and ventricular myocardium (lower) in a 10 PCW heart section. c, Spatial mapping of epicardial cells (EpC) (red), EPDC_1 (green) and EPDC_2 (blue) cells to the heart surface, subendocardium and atrioventricular groove (dashed line) in a 10 PCW heart section. d, Spatial mapping of Int_FB_1 (red), Int_FB_2 (green) and Int_FB_3 (blue) cells, illustrating their gradual spatial expansion and layer-specific positions in 6, 8, 10 and 12 PCW heart sections. e, Spatial mapping of MC and FB states enriched in the atrioventricular plane (dashed line) and cardiac valves. VICs (red), Valve_MC_2 (green) and Valve_MC_1 (blue) cells (upper), and EPDC_1 cells (red), AnnFibr_FBs (green) and FAPs (blue) (lower) are presented in a 12 PCW heart section. f, Dot plot displaying the top ten DEGs (log2FC > 0, P < 0.05) between the VIC, Valve_MC_1 and Valve_MC_2 clusters. g, ISS detection of PENK and LEF1 in cardiac valves in 6.5 PCW and 9 PCW heart sections. h, Spatial model of FB and MC state arrangements in the fetal heart’s fibrous skeleton and cardiac valves. EPDC_1, FAP and AnnFibr_FBs cells are enriched in the subepicardium of the atrioventricular groove, while Valve_MC_2 cells dominate the inner annulus fibrosus. Valve roots, linking to this rim, harbor Valve_MC_2 in atrioventricular and Valve_MC_1–2 cells in semilunar valves. ca, coronary artery; avg, atrioventricular groove; af, annulus fibrosus; mv, mitral valve; tv, tricuspid valve.
Our clustering also identified three distinct MC states in the developing cardiac valves (Fig. 6e,f and Extended Data Fig. 6f,g), further delineating their cellular diversity. Valve interstitial cells (VICs) expressing APCDD1, LEF1, TMEM132C and ADAMTS19 localized to the free segments of both valve sets, while Valve_MC_1 cells (FGF14, HDAC9, PLCXD3) appeared enriched in the roots of the semilunar valve cusps and surrounding segments of the annulus fibrosus but were largely absent from the atrioventricular valves. Meanwhile, Valve_MC_2 cells (PENK, FMOD, TIMP3) were present in and around the roots of both semilunar and atrioventricular valves and within the internal regions of the annulus fibrosus, in contrast to AnnFibr_FBs, which were more prominent in the subepicardial region and probably form the outer rim of this structure. Importantly, Valve_MC_2 cells featured a specific and robust expression of PENK, a previously described marker of mesenchymal neural crest derivatives in mouse hearts66 (Fig. 6f and Extended Data Fig. 6a,b). We observed strong spatial PENK signals in and around the developing semilunar and atrioventricular valves, supporting the long-debated contribution of neural crest cells to both valve structures in humans. Indeed, we observed PENK expression in the medially located leaflets of atrioventricular valves already at PCW 6.5, which appeared more spread out towards the lateral leaflets by PCW 9, along with a semilunar valve-related PENK signal present in both sampled aortic valve cusps (Fig. 6g). Taken together, our results imply a more substantial contribution of neural crest-derived mesenchyme to human cardiac valves than previously assumed. Based on these results, we assembled a spatial model of MC and FB cell states contributing to the fibrous skeleton and embedded valve structures in the fetal heart (Fig. 6h).
Spatially informed analysis of developmental cardiac niches
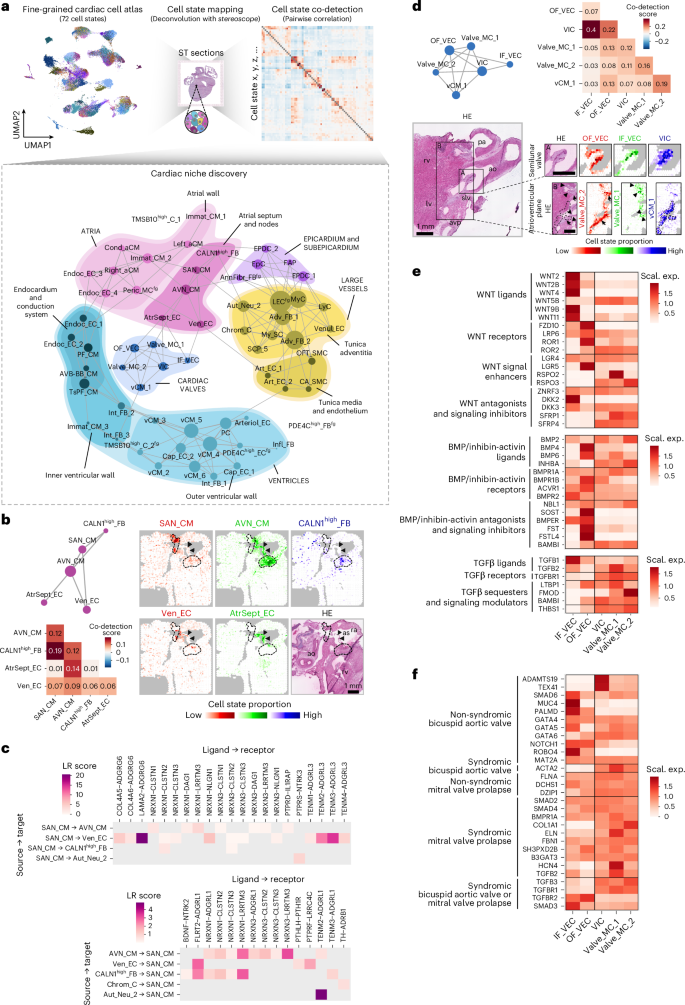
Cellular microcompartments have key roles in defining environmental cues that guide cell behaviors in early cardiogenesis. We used our in-depth spatial analysis to outline the cellular composition of major developmental tissue compartments and refined niches, enabling their targeted analysis. We investigated the spatial overlap of the 72 fine-grained single-cell states by calculating pairwise correlation-based co-detection scores and visualizing their topological relations (Fig. 7a and Supplementary Table 7), which yielded broadly consistent results across three developmental age groups (Extended Data Fig. 7a).
a, Schematic representation of the applied niche discovery strategy, using spatial mapping results of 72 fine-grained cell states for co-detection analysis (upper). Network graph of cardiac niches generated based on co-detection scores of >0.07, with gray lines representing spatial association and circle size reflecting the number of co-detected cell states (lower). Major cardiac structural components are delineated and labeled manually. b, Atrial septum and CPCS niche network graph and corresponding co-detection scores (left). Spatial mapping of SAN_CMs (red), AVN_CMs (green), CALN1high_FBs (blue) (upper right), Ven_ECs (red) and AtrSept_ECs (green) (lower right), outlining the atrial septum (arrowheads) and nodal tissue (dashed lines) in an 11 PCW heart section. c, Spatially informed cell–cell communication analysis between SAN_CMs, its cellular neighborhood and Chrom_Cs, highlighting ligand–receptor interactions included in a recently published neural-GPCR module of CellPhoneDB42, differentially expressed in the analyzed cell states within their respective subsets. d, Cardiac valve niche network graph and corresponding co-detection scores (upper). Spatial mapping of OF_VECs (red), IF_VECs (green), VICs (blue) (lower, ROI A) and Valve_MC_2 (red), Valve_MC_1 (green) and vCM_1 (blue) cells (lower, ROI B), highlighting dominant cellular components of semilunar valves (ROI A) and neighboring atrioventricular plane regions (ROI B), respectively, in a 12 PCW section. e, Heatmap representing per-gene scaled expression of WNT, BMP and TGFβ signaling components in valvular EC and MC states. f, Heatmap displaying per-gene scaled expression of bicuspid aortic valve disease-related and mitral valve prolapse-related genes in valvular EC and MC states. avp, atrioventricular plane.
Within the CPCS, we found substantial overlap between predicted positions of CALN1high_FBs, SAN_CMs and AVN_CMs, supporting the assumption that CALN1high_FBs represent a mesenchymal component of the developing nodal tissue (Supplementary Discussion 1). Of note, AVN_CMs showed the highest spatial co-detection scores with the AtrSept_EC state, implying the presence of conductive CMs in the atrial septum of the fetal heart (Fig. 7b). We also identified several potential ligand–receptor pairs between SAN_CMs and their cellular surroundings, including ones directed from the pacemaker cells towards closely localized venous ECs (Ven_EC), and others probably involved in contact formation with autonomic neurons (Aut_Neu_2) (Fig. 7c). Notably, CALN1high_FBs displayed a significant overlap in their interaction profile with SAN_CMs to a glial cell state recently discovered in the adult heart42, which suggests a potential hybrid function for this population under development. The ventricular CPCS components were most closely associated with one another and with the ventricle-enriched endocardial Endoc_EC_1 and Endoc_EC_2 cell states, displaying a temporal shift in PF_CM co-detection from Endoc_EC_1 to Endoc_EC_2, as well as differences in ligand–receptor interactions linked to trabecular morphogenesis and PF specification (Extended Data Fig. 7b).
Our analysis also demonstrated compositional differences between the great arteries (Art_EC_1, OFT_SMC, Adv_FB_1-2) and coronary arteries (Art_EC_2, CA_SMC, Adv_FB_2), consistent with differences in their developmental origins and functions, and a close spatial association between lymphatic endothelial (LECfg) and myeloid cells (MyC), essential for de novo lymphangiogenesis (Extended Data Fig. 7c)67. In parallel, we observed a temporal decrease of co-detection scores between EC states in consecutive segments of the coronary vasculature (Art_EC_1-2, Arteriol_EC, Cap_EC_1-2), reflecting their gradual spatial separation (Extended Data Fig. 7d).
By identifying five spatially distinct valvular EC and MC states, along with the vCM_1 population enriched at the valve roots and atrioventricular region of the ventricular myocardium, our study maps the developing human cardiac valve architecture with unprecedented spatial and cellular resolution (Fig. 7d and Extended Data Fig. 7e)56,68. Hence, we further charted the distribution of WNT, BMP and TGFβ signaling components, which are key regulators of valvulogenesis and contributors to congenital and acquired valve disease69, in these populations (Fig. 7e). IF_VECs displayed pronounced enrichment of WNT ligands (WNT2, WNT2B, WNT4, WNT9B, WNT11), antagonists and signaling inhibitors (ZNRF3, DKK2, DKK3), while OF_VECs expressed higher levels of WNT receptors (FZD10, ROR1, ROR2) and signal enhancers (LGR5), in addition to several BMP ligands (BMP4, BMP6) and antagonists (SOST, FST, FSTL4). These patterns align with the role of fluid forces, previously described to be mediated by KLF2 (and KLF4), in modulating WNT activation and BMP suppression63,70. Although side-specific distribution of WNT and BMP signaling has been reported in animal models, our study is the first to consistently map their compartmentalization in developing human valves.
The TGFβ axis exhibited subtler cell state differences, with IF_VECs expressing higher levels of ligands (TGFB1, TGFB2), and OF_VECs expressing higher levels of signaling modulators (LTBP1, BAMBI, THBS1). The valvular MC populations shared a more homogenous expression profile of these genes, including WNT5B and RORA, mediators of non-canonical WNT signaling linked to calcification and fibrosis in diseased adult aortic valves71. Notably, Valve_MC_1 cells showed marked enrichment of RSPO2, implicated in bicuspid aortic valve disease72, and Valve_MC_2 cells of FMOD, a regulator of the formation of a fibrous anchor between the valves and adjacent tissue73, consistent with their predicted positions.
Cardiac valves are frequently affected in both congenital and acquired heart diseases, yet the specific cellular drivers of these pathologies often remain unidentified. Here, we examined the expression patterns of genes linked to syndromic and non-syndromic forms of two major valve anomalies—bicuspid aortic valve and mitral valve prolapse74,75,76—across distinct valvular cell states (Fig. 7f). Although mitral valve prolapse-associated genes were broadly expressed, several genes implicated in non-syndromic bicuspid aortic valve disease showed marked enrichment in IF_VECs and VICs, highlighting these cell states as particularly vulnerable. These findings illustrate how our dataset can support future genetic studies by revealing spatial enrichment of candidate disease genes in relevant developmental contexts.
Source link
