Multimodal profiling of human SAT cell types
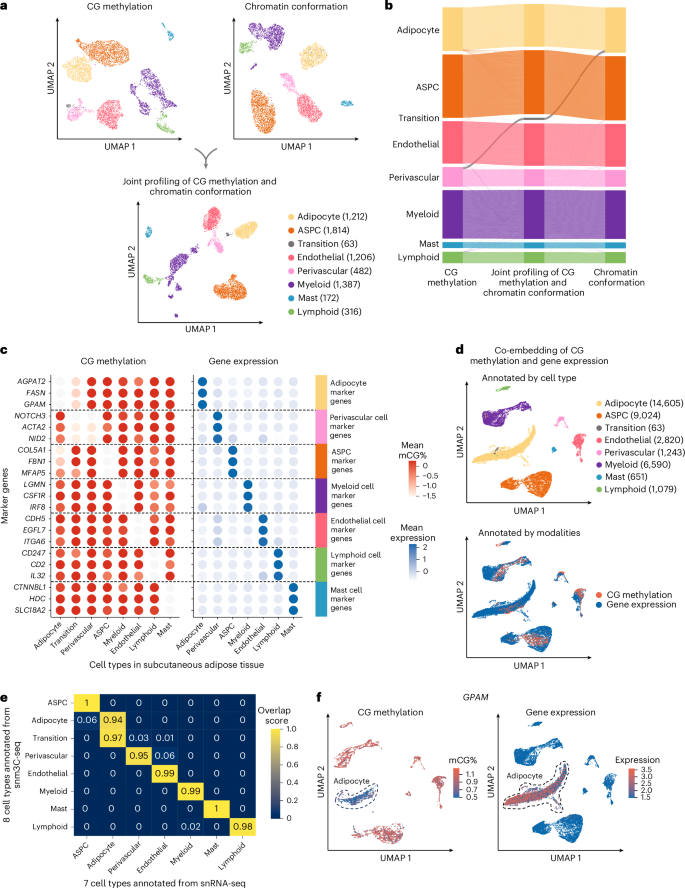
To investigate the cell-type-level epigenomic landscape of human SAT, we profiled DNA methylation, chromatin conformation and gene expression on nuclei isolated from SAT biopsies from Finnish females (Fig. 1 and Supplementary Note 1.1). We used snm3C-seq to simultaneously profile single-cell-level DNA methylation and chromatin conformation of nuclei isolated from five SAT biopsies (see Methods). A total of 6,652 nuclei passed our quality control (Supplementary Fig. 1a,b and Supplementary Note 1.2). We independently identified seven main cell types, including adipocytes, adipose stem and progenitor cells (ASPCs), perivascular, endothelial, myeloid, lymphoid and mast cells, using the global mCG of non-overlapping 5 kb bins and the intrachromosomal contacts among non-overlapping 100 kb bins (Fig. 2a and Supplementary Figs. 2 and 3). Notably, when analyzing the two modalities jointly to derive the de novo snm3C-seq annotation, we discovered a group of nuclei (n = 63 nuclei), present in all five samples (constituting the remaining 0.8 ± 0.6%), that demonstrated inconsistent cell-type annotations between the two modalities (that is, categorized as perivascular cells by mCG and as adipocytes by chromatin conformation) (Fig. 2b). We labeled them as a transitional cell-type cluster to highlight their potential developmental stage, observed using the two different omic profiles (Fig. 2a,b).
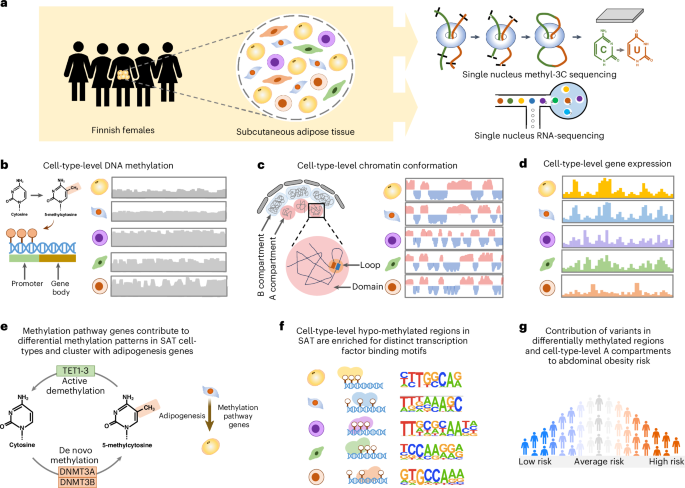
a, Illustration of snm3C-seq and snRNA-seq on nuclei isolated from SAT biopsies from Finnish females. b–g, Comprehensive analyses of DNA methylation, chromatin conformation and gene expression profiles across SAT cell types to identify cell-type-level differences in DNA methylation patterns (b) and chromatin conformation dynamics (c). Subsequently, we used the cell-type-level SAT expression data (d) to determine whether methylation pathway genes contribute to the observed differences in methylation patterns in SAT cell types and longitudinally cluster with adipogenesis pathway genes (e), identify cell-type-level TF binding motifs associated with hypomethylated regions in SAT cell types (f) and test the contribution of variants in cell-type-level DMRs and A and B compartments to the genetic risk of abdominal obesity (g).
a, Dimension reduction of cells using 5 kb bin mCG (top left), 100 kb bin chromatin conformation (top right) and jointly integrating mCG and chromatin conformation (bottom), profiled by snm3C-seq and visualized with uniform manifold approximation and projection (UMAP). Cells are colored by SAT cell type. b, Sankey diagram showcases the high consistency among the SAT cell-type annotations derived from the 5 kb bin mCG (left), 100 kb bin chromatin conformation (right) and joint profiling of mCG and chromatin conformation (middle), with the exception of the transition cell-type cluster that was annotated as perivascular cells by mCG and adipocytes by chromatin conformation. c–f, Integrative analysis with snRNA-seq, evaluating the concordance of cell-type cluster annotations and cell-type marker genes across modalities. c, Comparison of gene body mCG and gene expression profiles of cell-type marker genes across the matching SAT cell types, independently identified within the respective modalities, excluding the expression profiles of the transition cell-type cluster that was not identified in the SAT snRNA-seq data. Dashed lines stratify the marker genes by cell type. Dot colors represent the average gene body mCG ratio normalized per cell (left), and the average log-transformed counts per million normalized gene expression (right). d, Co-embedding of cells profiled by snm3C-seq and snRNA-seq. Cells are colored by annotations as in c (top) and modalities (bottom). e, Concordance matrix comparing the snm3C-seq and snRNA-seq derived annotations, colored by the overlapping scores between the pairs of the SAT cell types evaluated in the co-embedding space. f, UMAP visualization of the gene body mCG ratio (left) and gene expression (right) for one adipocyte marker gene, GPAM, colored per cell similarly as in c. The dashed line highlights the group of cells annotated as adipocytes.
We next investigated whether SAT snm3C-seq data can be integrated with SAT snRNA-seq data. First, we applied snRNA-seq on nuclei isolated from the same five SAT samples and three additional SAT samples from the Tilkka cohort to obtain 29,423 SAT nuclei (see Methods) and annotated them with matching cell-type resolution (Supplementary Note 1.3, Extended Data Fig. 1a and Supplementary Fig. 1c). Similar to previous brain results15, we observed strong and consistent correlations between gene body mCG hypomethylation and RNA expression across the identified cell types (Fig. 2c). This correlation enabled us to integrate and co-embed the snm3C-seq and snRNA-seq cells in the shared canonical component space19 (Fig. 2d, Extended Data Fig. 1b,c and Supplementary Fig. 4). Overall, these independently performed modality-specific annotations achieved a ≥0.94 overlap score across all cell-type pairs, in which a higher score indicates better integrated cells in the co-embedding space (see Methods) (Fig. 2e). Comparison between the snm3C-seq de novo annotation and its RNA-derived counterpart resulted in an adjusted Rand index of 0.975 and ≥0.95 confusion fraction (Extended Data Fig. 1d). Unique cell-type marker genes by these two modalities are shown in Supplementary Tables 1 and 2. Taken together, the observed cell-type epigenome profiles, identified using snm3C-seq, exhibit strong concordance with those derived from the snRNA-seq transcriptome; however, at the same time, they carry distinct modality-specific information. For example, the expression of a key adipocyte marker gene, GPAM, coincides with demethylation of the gene in the co-embedding space, which may allow for the recruitment of relevant proteins; for example, TFs (Fig. 2f and Extended Data Fig. 2a–f). In summary, mCG and chromatin conformation profiles generated by snm3C-seq robustly recapitulated epigenomic profiles of known major SAT cell types while also uncovering a subtle transition cluster, supporting the differentiation of human adipocytes through a previously less well-characterized route from the perivascular progenitors to adipocytes (Supplementary Note 1.4, Fig. 2, Extended Data Figs. 1 and 2 and Supplementary Figs. 5 and 6).
Modality-specific and modality-shared molecular mechanisms
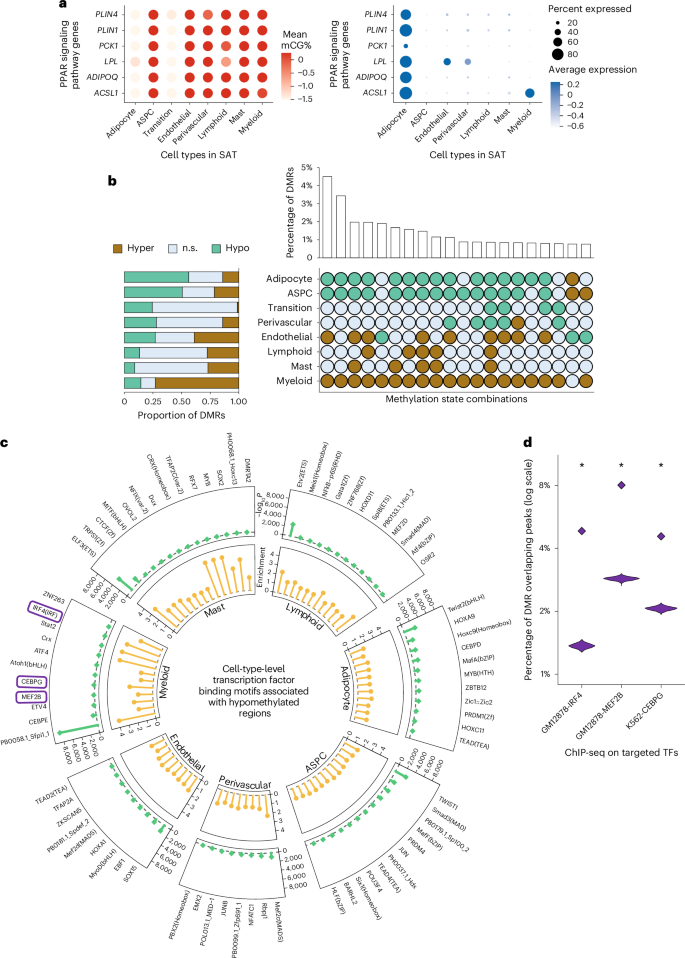
Highly expressed SAT cell-type marker genes, revealed by each modality, may elucidate how epigenomic regulation is involved in biological processes and pathways. For both gene body mCG and gene expression, we identified modality-specific and modality-shared marker genes across all SAT cell types (Supplementary Note 1.5 and Extended Data Fig. 3a) and subsequently in shared and non-shared biological processes (Extended Data Fig. 3b) and Kyoto Encyclopedia of Genes and Genomes (KEGG) pathways enriched among adipocyte marker genes (Extended Data Fig. 3c). In adipocytes, for instance, although only 77 marker genes (21% of mCG and 9% of gene expression markers) are present in both modalities, the majority of biological processes (63% of the pathways identified from mCG and 65% from gene expression) and KEGG pathways (65% of the pathways from both mCG and gene expression) are shared (Supplementary Note 1.6). Focusing on genes involved in the well-characterized PPAR signaling pathway, we observed that six genes, ACSL1, ADIPOQ, LPL, PCK1, PLIN1 and PLIN4, are hypomethylated in adipocytes and the transition cell type, while being hypermethylated in the rest of the cell types. Correspondingly, their transcriptomic profiles reveal that they are predominantly expressed only in adipocytes, with minimal expression in other SAT cell types (Fig. 3a). Similarly, fat cell differentiation genes ADIPOQ, LPL, LEP, TCF7L2, AKT2 and SREBF1 are hypomethylated and predominantly expressed in adipocytes compared to the other SAT cell types (Extended Data Fig. 3d). Additionally, modality-shared adipocyte marker genes encode TFs, encompassing both known and less-known regulators critical to SAT (Supplementary Note 1.7 and Extended Data Fig. 3e,f). Collectively, these findings suggest a coordinated regulation of key pathways, biological processes and TFs through both transcriptional and epigenomic mechanisms.
a, Dot plots of PPAR signaling pathway genes (ACSL1, ADIPOQ, LPL, PCK1, PLIN1 and PLIN4) that are shared adipocyte marker genes between the gene body mCG and gene expression modalities, showing their gene body mCG (left) and gene expression profiles (right) across SAT cell types. The color of the dot represents the mean percentage of mCG (left) and average expression of genes (right), while the size of the dot represents the percentage of cells in which the gene is expressed (right). b, Horizontal stacked bar plot (left) showing the marginal proportions of assigned methylation states across DMRs for each SAT cell type (n.s., non-significant) and upset plot (right) displaying the top 20 most prevalent methylation state combinations across all detected DMRs, ordered by decreasing frequency, along with their respective percentages. c, Circular plot summarizing the cell-type-level TF binding motifs associated with hypomethylated regions in SAT cell types. Statistical significance was determined using HOMER (binomial test) on each cell type separately. The false-positive rate was calibrated by a stringent cutoff on the unadjusted P values (that is, P < 1 × 10⁻¹²). Track 1 shows the negative log P values (green lollipops) and track 2 shows the enrichment scores (yellow lollipops). d, Violin plots reflecting the empirical null distribution (n = 1,000) of the percentages of DMRs overlapping ChIP-seq peaks for three TFs highlighted in c (see Methods). Diamonds mark the observed overlapping proportion of the hypomethylated regions in myeloid cells in the corresponding ChIP-seq experiment. Asterisks (*) indicate statistical significance, evaluated based on a one-tailed hypergeometric test for overrepresentation of peaks in the corresponding cell-type-level hypomethylated regions (−log10P = 646, 1,860 and 1,618 for IRF4, MEF2B and CEBPG, respectively). GM12878, lymphoblastoid cell line; K562, chronic myelogenous leukemia cell line.
Striking differences between adipocytes and myeloid DMRs
To delineate the patterns of cell-type-level DNA methylation in SAT, we identified genome-wide DMRs in eight SAT cell types (adipocytes, ASPCs, transition, perivascular, endothelial, myeloid, lymphoid and mast cells) using methylpy20,21 (see Methods). Overall, 15.4% of the CG sites are differentially methylated across the SAT cell types, with a total of 705,063 CG DMRs covering 5.39% of the genome. These DMRs have a mean (±s.d.) length of 220 ± 152 bp and consist of an average of 4.5 ± 5.5 differentially methylated sites (DMSs). The large numbers of DMRs we identified in SAT cell types support distinct cell-type-level methylation patterns.
We observed striking genome-wide differences in the number and abundance of hypomethylated and hypermethylated regions among the SAT cell types (Fig. 3b and Supplementary Table 3). In particular, of the total DMRs, 56.3% (n = 396,758; −log10P = 129 using one-tailed t-test; see Methods) and 50.6% (n = 356,844; −log10P = 104, one-tailed t-test) are hypomethylated in adipocytes and ASPCs, contrasting with only 14.6% (n = 102,756) in myeloid cells. Conversely, we observed that up to 73.0% of the DMRs demonstrate a hypermethylation pattern in the myeloid cells (n = 514,434; −log10P = 163, one-tailed t-test) versus merely 14.2% in adipocytes and 21.4% in ASPCs. Jointly investigating the differential methylation states across all cell types revealed that 47.3% of the DMRs exhibit opposing profiles between adipocytes, ASPCs and those of the myeloid cells. Taken together, our finding suggests that the widespread repression of regulatory activity in myeloid cells is typically associated with heightened regulatory activity in adipocytes and ASPCs.
Cell-type-level TF binding motifs
To investigate the relevance of cell-type-level hypomethylated regions in gene regulation, we performed TF binding motif enrichment analysis using cell-type-level hypomethylated regions. We identified several cell-type-level TFs (Supplementary Note 1.8, Fig. 3c, Extended Data Fig. 4 and Supplementary Table 4), suggesting that these TFs might either bind to the DNA in a cell-type-specific manner or regulate cell-type-level differential methylation patterns. We then sought to validate the cell-type-level TFs that we identified using HOMER22 (Fig. 3c) by analyzing external chromatin immunoprecipitation sequencing (ChIP-seq) data from ENCODE23 (see Methods). As only immune cell ChIP-seq data are available among the SAT cell types, we focused on validating myeloid-specific TFs (Fig. 3c). As expected, binding peaks for the TFs IRF4 and MEF2B in GM12878 demonstrate 3.5-fold and 2.8-fold enrichments compared to the matching genomic background (empirical P < 0.001 for both TFs, −log10P = 1,618 and 1,860 using one-tailed hypergeometric test, respectively) (Fig. 3d, Extended Data Fig. 5 and Supplementary Table 5). For CEBPG binding peaks in K562, we observed a 2.2-fold enrichment (empirical P < 0.001, −log10P = 647 using one-tailed hypergeometric test) (Fig. 3d, Extended Data Fig. 5 and Supplementary Table 5). Together, these TF enrichments using ENCODE ChIP-seq data in a relevant cell line independently validated our de novo TF results obtained using HOMER (Fig. 3c).
Enrichment of short-range interactions in SAT adipocytes
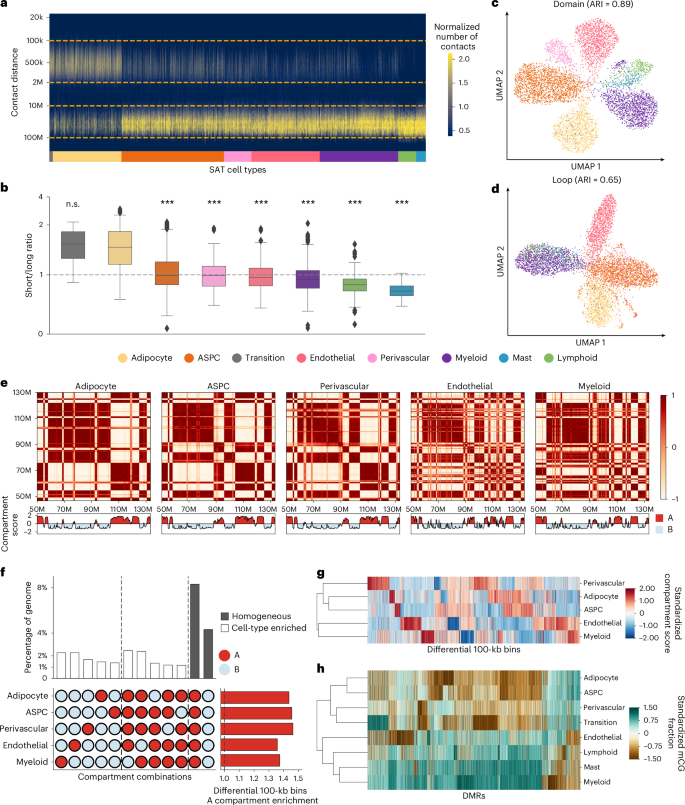
Tight packaging of DNA inside the nucleus leads to physical contacts between genomic regions, which affects the gene expression machinery24. We observed substantial differences in the distribution of closely and distantly located interaction contacts at various genomic distances across the cells profiled by snm3C-seq (see Methods). In pairwise comparisons with other cell types, adipocytes harbor significantly higher proportions of short-range interactions (100 kb to 2 Mb) compared to long-range interactions (10–100 Mb), with the exception of the transition cell type (−log10P > 91; one-tailed Wilcoxon rank-sum test) (Fig. 4a,b and Supplementary Note 1.9). This observation is in line with all cell-level clustering analyses using chromatin conformation information at various resolutions, which indicate that the transition cell type shares more similarity with adipocytes (Figs. 2b and 4c,d and Extended Data Fig. 6a,b).
a,b, Frequency of contacts per cell against genomic distance (y axis in log scale), grouped by cell types (a) and ordered by the median short-range to long-range interaction ratios (b). Dashed lines in a mark short-range and long-range contacts. The center of the box in b represents the median; the bounds of the box indicate the 25th and 75th percentiles and the whiskers show the minimum and maximum values within 1.5 times the interquartile range. Statistical significance was evaluated based on pairwise one-tailed Wilcoxon rank-sum tests for a higher short-range interaction ratio in adipocytes. Asterisks (***) indicate unadjusted −log10P > 50. Specifically, unadjusted −log10P = 197, 116, 221, 258, 128 and 91 for ASPCs, perivascular, endothelial, myeloid, lymphoid and mast cells; n = 63, 1,212, 1,814, 482, 1,206, 1,387, 316 and 172 for transition, adipocytes, ASPCs, perivascular, endothelial, myeloid, lymphoid and mast cells, respectively. c,d, UMAP visualization of low-dimensional embeddings of cells using domains (c) and loops (d) as features, colored by the snm3C-seq annotation; adjusted Rand index (ARI) evaluates the clustering concordance against snm3C-seq annotation. e, Heatmap visualization of the normalized interaction contact map on chromosome 12 and its corresponding compartment scores. f, Upset plot (left) visualizing a subset of the differential 100 kb bins and their corresponding percentages; horizontal stacked bar plot (right) showing the marginal A compartment enrichment of differential 100 kb bins. The vertical dotted line separates cell-type-level A compartment flips, B compartment flips and differential bins detected within homogeneous A or B compartments. g, Dendrogram of the five most abundant SAT cell types constructed with compartment scores on differential 100 kb bins. h, Similar to g, except on all annotated SAT cell types, constructed with mCG fractions across DMRs.
In addition, the observed differences in the ratio of short-range to long-range interactions between ASPCs and adipocytes (one-tailed Wilcoxon rank-sum −log10P > 197) could suggest a link between the contact distances and functionally important genomic regions in adipogenesis. Given that ASPCs develop into adipocytes, we speculate that this change may reflect the unilocular lipid droplet formation in adipocytes that makes them larger than ASPCs.
Chromosomal conformation dynamics reflect cell-type lineage
Chromatin compartments, which connect stretches of the genome that are tens of megabases apart, reflect how cells arrange their chromosomal structures in three-dimensional space at the highest level25. We started our investigation of aggregated SAT cell-type-level genome spatial topology by calculating the compartment scores on the pseudobulk contact matrices for the five most abundant cell types (adipocytes, ASPCs, endothelial, perivascular and myeloid cells) at 100 kb resolution. Based on the sign of the compartment scores, we partitioned the genome into either the active A compartment regions or the more repressive B compartment regions. The correlation matrices derived from the normalized interaction contact maps revealed visually distinct cell-type-level plaid patterns. For example, on chromosome 6 (Extended Data Fig. 6c) and chromosome 12 (Fig. 4e), endothelial and myeloid cells harbor more intricate structures, indicated by the frequent compartment switches, whereas adipocytes, ASPCs and perivascular cells tend to have longer stretches of region being annotated as the same compartment (Supplementary Note 1.10 and Extended Data Fig. 6d).
Upon a closer inspection, a total of 11,571 100 kb bins, spanning 44.3% of the genome, are statistically differentially conformed among the five cell types at a false discovery rate (FDR) < 0.1 cutoff. The empirical FDR is estimated to be ≤0.02 (see Methods). Although each cell type has its own distinct pattern of chromosomal compartments, differential 100 kb bins consistently demonstrate at least a 1.36-fold enrichment landing in the active A compartments compared to the genome-wide background (Fig. 4f, Extended Data Fig. 6e and Supplementary Table 6). Interestingly, across all investigated SAT cell types, the two leading predominant compartment combinations are the homogeneous A and B. These combinations account for 18.8% and 9.7% of the total differentially conformed regions (8.3% and 4.3% of the genome), suggesting significant heterogeneity within each compartment stratification (that is, A and B). These are followed by combinations driven by myeloid and endothelial cells, either through cell-type-level compartment flips (A→B or B→A) or coordinated flips involving both cell types (Supplementary Note 1.10 and Extended Data Fig. 6e–g). Given that we observed similar distinct mCG patterns for endothelial and myeloid cells, we aimed to confirm whether the lineage dendrogram constructed from differential 100 kb bins would mirror the developmental trajectory inferred from DMRs. Indeed, hierarchical clustering consistently grouped endothelial and myeloid cells, characterized by pronounced hypomethylation and frequent compartmental switches, into a distinct branch in both modalities (Fig. 4g,h), in line with a previous report showing that myeloid progenitors also give rise to vascular endothelial cells26.
Cell-type specificity in regional 3D genome structures
In addition to compartmentalization, the genome maintains its finer spatial structure by forming interaction domains and cohesion-mediated chromatin loops. Analyzing snapshots of the 3D genome at 25 kb and 10 kb resolution allowed us to delineate these regional features at both cell and aggregated cell-type resolution. In addition to the transition cell type, adipocytes showcase an accumulation of significantly denser interaction domains (an average of 4,120 per cell, compared to 3,574 in others; −log10P > 45, pairwise one-tailed Wilcoxon rank-sum test), while spanning a much shorter distance (median of 679,121 bp per cell, compared to 783,213 bp in others; Extended Data Fig. 7a–c). Interestingly, the number of detected domains is highly correlated with the ratio of short-range to long-range interactions (Pearson’s correlation coefficient, 0.76; Extended Data Fig. 7d). This observation reinforces the idea that regional contacts are necessary to support the more intricate local 3D structures. Both features correlate with the general transcriptomic activity in the matching snRNA-seq data, in which adipocytes show a 1.5-fold increase in the total number of unique molecular identifiers (Extended Data Fig. 7e,f). Overlapping cell-type pseudobulk insulation scores with boundary probability, calculated as the fraction of cells with a boundary detected in a given cell type, identified a total of 1,791 differential boundaries (see Methods). Regarding chromatin loops, we detected a median of 47,837 and 5,797 cell-type-level loop pixels and merged loop summits, respectively. Adipocytes demonstrate a similar trend of having more loop summits (n = 8,852) and a relatively shorter median loop length (230,000 bp, compared to others 290,000 bp; Extended Data Fig. 7g,h). Along with the clustering results derived from regional interaction features (for example, insulation scores, domains and loops), which show highly concordant annotations (Fig. 4c,d and Extended Data Fig. 6a,b), we conclude that granular 3D genomic features also exhibit significant heterogeneity across SAT cell types.
Influence of 3D topology on gene regulatory landscapes
The 3D topology of a cell also influences its transcriptomic dynamics with cell-type specificity. As expected, genes expressed in a cell tend to localize in its active A compartment, exhibiting ≥2.24-fold enrichment relative to the B compartments across the five most abundant cell types. These ratios increase when restricted to the set of cell-type-level unique marker genes. Perivascular cells, in particular, exhibit a staggering 13-fold A/B ratio, leading to 92.8% of the unique marker genes landing in the A compartments (Supplementary Table 7). We next focused on ASPCs, a cell type that undergoes active differentiation into adipocytes, and systematically evaluated how compartment flipping affects the downstream expression. On a global scale, 23.4% of the differentially conformed regions change from the ASPC A compartments to adipocyte B, while 27.5% convert from the B compartments to A. Residing within these topologically interesting regions are some key cell-type marker genes crucial for adipogenesis (Supplementary Note 1.11). For example, ADIPOQ is located in an interaction domain unique to adipocytes with a pronounced demethylation pattern around its gene body, probably facilitating additional TFs to bind and activate it functionally. The adjacent differential boundary marks a stretch of the genome, encapsulating 1 Mb upstream and downstream of ADIPOQ, that transitions from the inactive B compartments in ASPCs to the active A compartments in adipocytes (Extended Data Fig. 8a). Other strong gene expression de novo adipocyte marker genes, including TENM3, CSMD1 and PCDH9, also land within differential domains specific to adipocytes; additionally, CSMD1 and PCDH9 have cell-type-level loop domains near the transcription start sites (Extended Data Fig. 8b and Supplementary Fig. 7a,b). Together, our findings suggest that chromosome conformation, ranging from mega-base compartmentalization to kilo-base loop formation, reflects a higher level of carefully balanced coordination among the SAT cell types, influencing both their epigenetic regulation profiles and trickling down to their transcriptional activities.
Contribution of DNMT3A and TET1 to DMR patterns
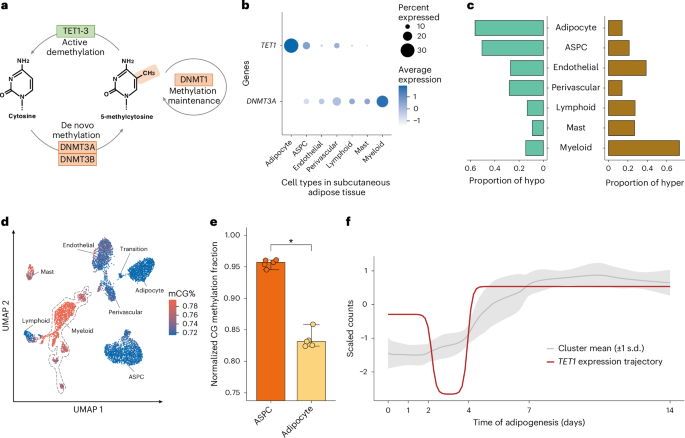
DNA methylation involves the covalent addition of a methyl group to DNA, a process facilitated by DNA methyltransferase enzymes, such as DNA methyltransferase 3 alpha (DNMT3A) and DNA methyltransferase 3 beta (DNMT3B)27. Conversely, DNA demethylation comprises the removal of this methyl group from the DNA by the ten-eleven translocation (TET) family proteins, specifically, TET1, TET2 and TET3 (Fig. 5a). Among the demethylase genes, TET1 is preferentially expressed in adipocytes (−log10P > 300; two-sided Wilcoxon rank-sum test) (Fig. 5b), in line with our observation that adipocytes have significantly more hypomethylated (56.3%) than hypermethylated regions (14.2%) (Fig. 5c,d). Among the DNA methyltransferases, our cell-type-level SAT snRNA-seq data show that DNMT3A is predominantly expressed in myeloid cells, with minimal or no expression in adipocytes (−log10P = 136; two-sided Wilcoxon rank-sum test) (Fig. 5b). Consistent with our DNMT3A expression results, 73.0% of DMRs are hypermethylated in the myeloid cells while only 14.2% are hypermethylated in adipocytes (Fig. 5c). In addition, the expression of a methylation maintenance gene, DNMT1, is significantly lower in adipocytes than other SAT cell types (−log10P = 170; two-sided Wilcoxon rank-sum test) (Extended Data Fig. 9a). Expression of other methylation (DNMT3B and UHRF1) and demethylation genes (TET2, TET3 and TDG), shown in Extended Data Fig. 9a,b, suggest that TET1 and DNMT3A are the most important genes that contribute to the observed adipocyte hypomethylation and myeloid hypermethylation patterns, indicating their potential mechanistic role in cell-type-level DNA methylation signatures in SAT. The SAT bulk RNA-seq dataset further revealed that bulk expression of DNMT3A is negatively associated with insulin sensitivity using the Matsuda Index, whereas bulk expression of TET1 is positively correlated with the Matsuda Index (Supplementary Note 1.12 and Supplementary Table 8). In addition, we observed that TET1 is temporally co-expressed with known adipogenesis genes across human primary preadipocyte differentiation (Supplementary Note 1.13, Fig. 5e,f and Supplementary Table 9). Taken together, the cell-type-level expression patterns of DNMT3A in myeloid cells and TET1 in adipocytes suggest that their association signals with CMD traits we observed in the SAT bulk expression may largely originate from their high expression in these two specific cell types.
a, A schematic representation of basic mechanisms and key players in DNA methylation and demethylation. b, Dot plot of TET1 and DNMT3A showing their expression profiles across the SAT cell types. The size of the dot represents the percentage of cells in which a gene is expressed within a cell type, and the color represents the average expression of each gene across all cells within a cell type (blue indicates higher expression). c, Proportions of assigned hypomethylated (left) and hypermethylated states (right) across DMRs. d, UMAP visualization of the average global mCG ratio in a cell. The dashed line highlights those annotated as myeloid cells. e, Bar plot reflecting the distribution of normalized mCG fractions across genes that co-clustered with TET1 in f for ASPCs and adipocytes. Asterisk (*) indicates statistical significance from a paired one-tailed Wilcoxon rank-sum test, comparing the median cluster expression across n = 5 samples, showing higher expression in ASPCs than in adipocytes (unadjusted P = 0.031). The center of the bar represents the median, and the error bars represent the highest and lowest expression across n = 5 samples. f, Longitudinal expression of TET1 is plotted across the 14-day SAT preadipocyte differentiation. The shaded ribbon behind the trajectory of TET1 reflects the mean and standard deviation of the genes that clustered into similar trajectory patterns as TET1 using DPGP.
Variants in DMRs and compartments are enriched for CMD risk
We next explored the genetic contributions to key CMDs relevant to SAT from variants residing in the cell-type-level compartments and DMRs. Specifically, we assessed abdominal obesity using waist-hip-ratio adjusted for body mass index (WHRadjBMI) as its well-established proxy28,29, body mass index (BMI), CRP and metabolic dysfunction-associated steatotic liver disease (MASLD) in the UK Biobank (UKB)30,31.
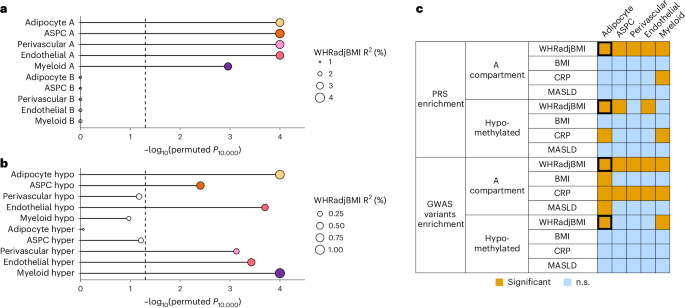
We first evaluated the partitioned polygenic risk of variants landing in cell-type-level compartments and DMRs (see Methods). Among the four traits, we highlight WHRadjBMI. All WHRadjBMI polygenic risk scores (PRSs) built from variants in the cell-type-level A compartments are significant (PR2 < 0.05) and enriched predictors (Pperm10,000 < 0.05), explaining ≥80% of variance in WHRadjBMI captured by the full genome (Fig. 6a, Extended Data Fig. 10a,b and Supplementary Table 10). Conversely, we observed no PRS enrichment from the B compartments. We also observed enrichment of the WHRadjBMI polygenic risk from variants in cell-type-level DMRs and strong genetic contributions to CMDs from the target eGenes of the SAT cis-expression quantitative trait locus variants, residing in these cell-type-level DMRs using HuGE scoring32 (Supplementary Note 1.14, Fig. 6b and Supplementary Tables 11 and 12). Additionally, we found that PRSs constructed from the A compartments and the hypomethylated regions of myeloid cells are enriched predictors of CRP, suggesting a low-grade inflammatory role for this immune cell type (Supplementary Note 1.14, Fig. 6c and Supplementary Tables 10 and 11).
a,b, Lollipop plots depict the incremental variance explained of each cell-type-level PRS for abdominal obesity (using WHRadjBMI as a proxy) from the (a) A and B compartments and (b) hypomethylated and hypermethylated regions. Each lollipop represents a WHRadjBMI PRS, in which dot size corresponds to the incremental variance explained of the PRS. Significant enrichment of incremental variance explained was determined empirically by comparing to n = 10,000 permutated PRSs (see Methods). The gray vertical dashed line indicates the significance cutoff based on unadjusted one-tailed permutation P values (that is, Pperm10,000 < 0.05). Bars and lollipops corresponding to cell types with significantly enriched PRSs are colored by cell type, whereas those without are outlined in gray without a filling. c, Summary table visualizing the overall PRS and GWAS enrichment results across four key cardiometabolic traits (that is, WHRadjBMI, MASLD, BMI and CRP), stratified by cell-type-level hypomethylated regions and A compartments. Orange indicates nominal significance (P < 0.05) on the one-tailed permutation P values for PRSs and the one-tailed hypergeometric P values for GWAS enrichment. The bolded black border highlights the following consistently significant cell-type-cardiometabolic trait pair: adipocyte–WHRadjBMI.
Next, we examined the cell-type-level compartments and DMRs for overrepresentation of independent GWAS variants for the four outcomes. We observed that all five cell-type-level A compartments are enriched for both WHRadjBMI and CRP GWAS variants (Fig. 6c, Extended Data Fig. 10c and Supplementary Table 13). Adipocyte A compartments are additionally enriched for BMI and MASLD GWAS variants. For DMRs, we observed enrichment of WHRadjBMI GWAS variants in adipocyte and myeloid hypomethylated and in ASPC and perivascular hypermethylated regions, as well as strong genetic contributions to obesity-related outcomes from their adjacent genes using HuGE scoring (Supplementary Note 1.14, Fig. 6c and Supplementary Table 14).
Overall, our results highlight the SAT cell-type-level methylation and spatial conformation profiles as important contexts underlying the genetic risk of CMDs, with the hypomethylated regions and the active A compartments of adipocytes giving the strongest signal for abdominal obesity risk and the A compartments of myeloid cells more indicative of inflammation risk.
Source link
