Just a few years ago, housing markets in the warm, sunny parts of the US looked, well … warm and sunny. In the halcyon days of 2021 and 2022, cities like Austin, Tampa, Phoenix, and Atlanta attracted swarms of movers. Home listings reliably drew multiple offers above the asking price, and buyers plunked down all-cash offers to fast-track their purchases.
Flash forward to today, and the big “winners” of the work-from-home reshuffle — metros that drew hordes of footloose workers and disaffected coastal dwellers — have turned into losers. Fewer people are moving to so-called Zoomtowns. Home listings are piling up on the market. Prices are dropping. The anxiety has shifted from buyers trying to elbow their way in to sellers just trying to offload their properties. A new report by the real estate analytics firm Parcl Labs, shared exclusively with Business Insider, shows that home sellers in the lower half of the US, also known as the Sun Belt, are the most desperate in the country.
Housing markets in the Midwest and Northeast, on the other hand, are going strong. Inventory in those parts of the country remains tight, and prices are up. Homes are selling at a brisker pace than in the rest of the US. These cities didn’t garner much attention during the pandemic (how many glowing headlines did you see about Buffalo, Cleveland, Milwaukee, or Detroit?), but sellers there have quietly held onto their bargaining power. By practically any measure, the country’s real estate leaderboard has flipped.
“We are in a two-tiered housing market,” Mike Simonsen, the chief economist at the brokerage firm Compass and the cofounder of Altos Research, tells me. “It’s really stark.”
At first glance, this might seem like a simple tale of supply: Builders flocked to the Sun Belt and put lots of shovels in the ground, setting the stage for an inevitable drop in prices when all those new houses hit the market. Sure, that’s part of it. But this is also a story about even bigger shifts in the labor market, migration trends, and affordability — why people are (or aren’t) moving, and where they’re choosing to put down stakes. The Sun Belt isn’t drawing movers like it used to, while the Midwest and Northeast are holding onto more people than they did during those peak pandemic years. Even more troubling, many Americans aren’t moving at all. They’re stuck in place, scared to quit their jobs or trade their cheap mortgage rates for more expensive ones. With no signs of a reversal on the horizon, the new housing-market winners could stay on top for years to come.
Americans move in predictable patterns. Over the past few decades, the Northeast and Midwest hemorrhaged people to the Sun Belt, where jobs were plentiful, the weather balmier, and homes cheaper. Between mid-2018 and mid-2019, the last full year of Census data before the pandemic set in, the Northeast lost a net 294,000 residents to other parts of the country, while the Midwest lost nearly 162,000. The South, on the other hand, gained almost 408,000 people, and the West saw an uptick of 48,000.
“We’ve been moving from the North to the South for many years,” Simonsen tells me. “We build the houses in the South. We sell our homes in the North.”
Housing demand surged early in the pandemic — the country’s homeowning ranks swelled by a whopping 2.2 million people between the first quarter of 2020 and the same point in 2022, an analysis by the Harvard Joint Center for Housing Studies shows. But for all the talk of upheaval, movers more or less stuck to those pre-pandemic flight patterns — just at warp speed. People kept migrating from big-city centers to the suburbs and from the North to the South. Sun Belt states, including Florida, Texas, Arizona, and North Carolina, experienced the largest population gains from domestic migration between mid-2020 and mid-2021, per a Harvard analysis of Census data. The Dallas metro, for example, gained around 63,000 people from other parts of the country that year, a huge jump from just 19,000 the year prior. Phoenix, Tampa, Austin, and Charlotte recorded similar increases. Expensive states with large urban areas, including California, New York, Illinois, and Massachusetts, saw the biggest losses.
While migration may follow long-held trends, the idea of a “national” housing market is really a myth — every city, town, even ZIP code, has its own quirks. The chaotic reshuffle of the pandemic’s early days, however, resulted in the closest thing we’ve seen to local markets around the country moving in the same direction: Prices went up, and inventory went down. Even if some states saw far more new arrivals than others, buyers all over the place jumped into the market in search of cheap mortgage rates, more space, and the promise of generational wealth, even if the move was just down the street. This led to higher prices practically across the board (with the exception of big cities that lost a ton of people, like San Francisco). Now, though, the country is splitting into two distinct markets. If someone’s looking to sell a home these days, their prospects look a lot different depending on whether they’re in Boise or Buffalo.
We are in a two-tiered housing market. It’s really stark.Mike Simonsen, chief economist at Compass
In the Sun Belt and Mountain West, homebuilders saw the demand signals from the national moving moment and got busy. “There’s a herd mentality, for sure,” says Ryan McKeveny, a managing director at the housing research firm Zelman, a Walker & Dunlop company. Homebuilders, he tells me, “all gravitate to the same exact markets.” The Census estimates that the housing stock in the South region surged by almost 3.3 million between 2020 and 2024, compared to just 750,000 in the Midwest and a measly 483,000 in the Northeast. Despite the rush to break ground, those homes didn’t materialize all at once. It usually takes a couple of years for new homes to crop up. In the meantime, prices in the Sun Belt spiked.
Take Austin. The Texas capital was the fastest-growing large metropolitan area from 2020 to 2022, Census data shows, adding a net 120,000 people for a population increase of 5.3%. Even with a surge in homebuilding, supply simply could not keep up: The typical home price in Austin jumped by more than 60% in that same time period, Zillow found. Eventually, though, the builders made up some ground. By last fall, Austin’s for-sale housing stock had climbed by more than 76,000 units, or 8.34%, since 2020, Parcl Labs found, a monumental feat for a city that large. At the same time these new units came onto the market, however, the flow of people to Austin started to abate. Net domestic migration totaled less than 14,000 from mid-2023 to mid-2024, still positive but well below the high of 44,000 in 2021. Buyers were also pulling back in the face of higher mortgage rates, which translate into vastly more expensive monthly payments. Fewer buyers, more homes up for sale — you can imagine what happens next. Austin home values have dropped more than 23% from their peak in the summer of 2022, Zillow data shows.
A recent Zelman analysis shows that pandemic-era hot spots like Denver, Austin, Memphis, Tampa, and Dallas have seen big upticks in active inventory, or the number of homes available for sale, while median prices are down year over year. In Denver, for example, inventory is up almost 50% from the same point in 2019, while the median price is down slightly from a year ago. Dallas prices are down almost 2% year-over-year, while inventory is up more than 20% from 2019. Net migration to Florida and Texas remains positive, according to a Zelman analysis, but is lower than in 2019. The Dallas metro added just 25,000 people via domestic migration in the 12-month period ending June 2024, down from 91,000 a couple of years prior. Tampa’s increase of 11,000 was a fraction of its 54,000-person gain during the height of the relocation bonanza.
A comedown from the pandemic-era frenzy may not come as a surprise. More interesting are the markets where sellers undeniably have the upper hand. These metros in the Northeast and Midwest mostly weren’t subject to the huge price run-ups that were commonplace in the Sun Belt, but they didn’t get a ton of new supply from homebuilders, either — those guys were focused on carving out new home communities down south. Inventory levels in places like Buffalo, Milwaukee, Detroit, and Cleveland are still below their 2019 watermarks, per Zelman’s analysis, while prices have increased by anywhere from 4% to 8% compared to a year ago. People aren’t exactly rushing to move to these areas — it’s just that the decades of migration losses have seriously slowed. The Cleveland metro lost just 3,500 people on net in 2024, compared to nearly 10,000 in 2021. Same story in Milwaukee. The Minneapolis-St. Paul metro notched a slight increase last year after bleeding a whopping 14,000 residents via net domestic migration in 2021.
Related stories

Business Insider tells the innovative stories you want to know
Business Insider tells the innovative stories you want to know
The North-to-South movement still holds, but the North is losing fewer people, and the South isn’t gaining like it once was. The most recent numbers, for the yearlong period ending in mid-2024, show net domestic migration to the South was down almost 38% compared to the first year of the pandemic. Domestic migration to the Midwest, on the other hand, is up about 60% in that same period, though it’s still negative in absolute terms. The Northeast’s net loss was down to 192,000 in the latest tally, compared to a loss of 390,000 at the height of the pandemic. With the migration tide receding, sellers in once-hot metros are getting real. In Denver, Charlotte, Jacksonville, and a smattering of other Sun Belt markets, more than half of single-family homes for sale have seen a price cut, Parcl Labs data shows. In the Boston, Philadelphia, and Buffalo metros, the share of listings in that bucket drops to fewer than a third.
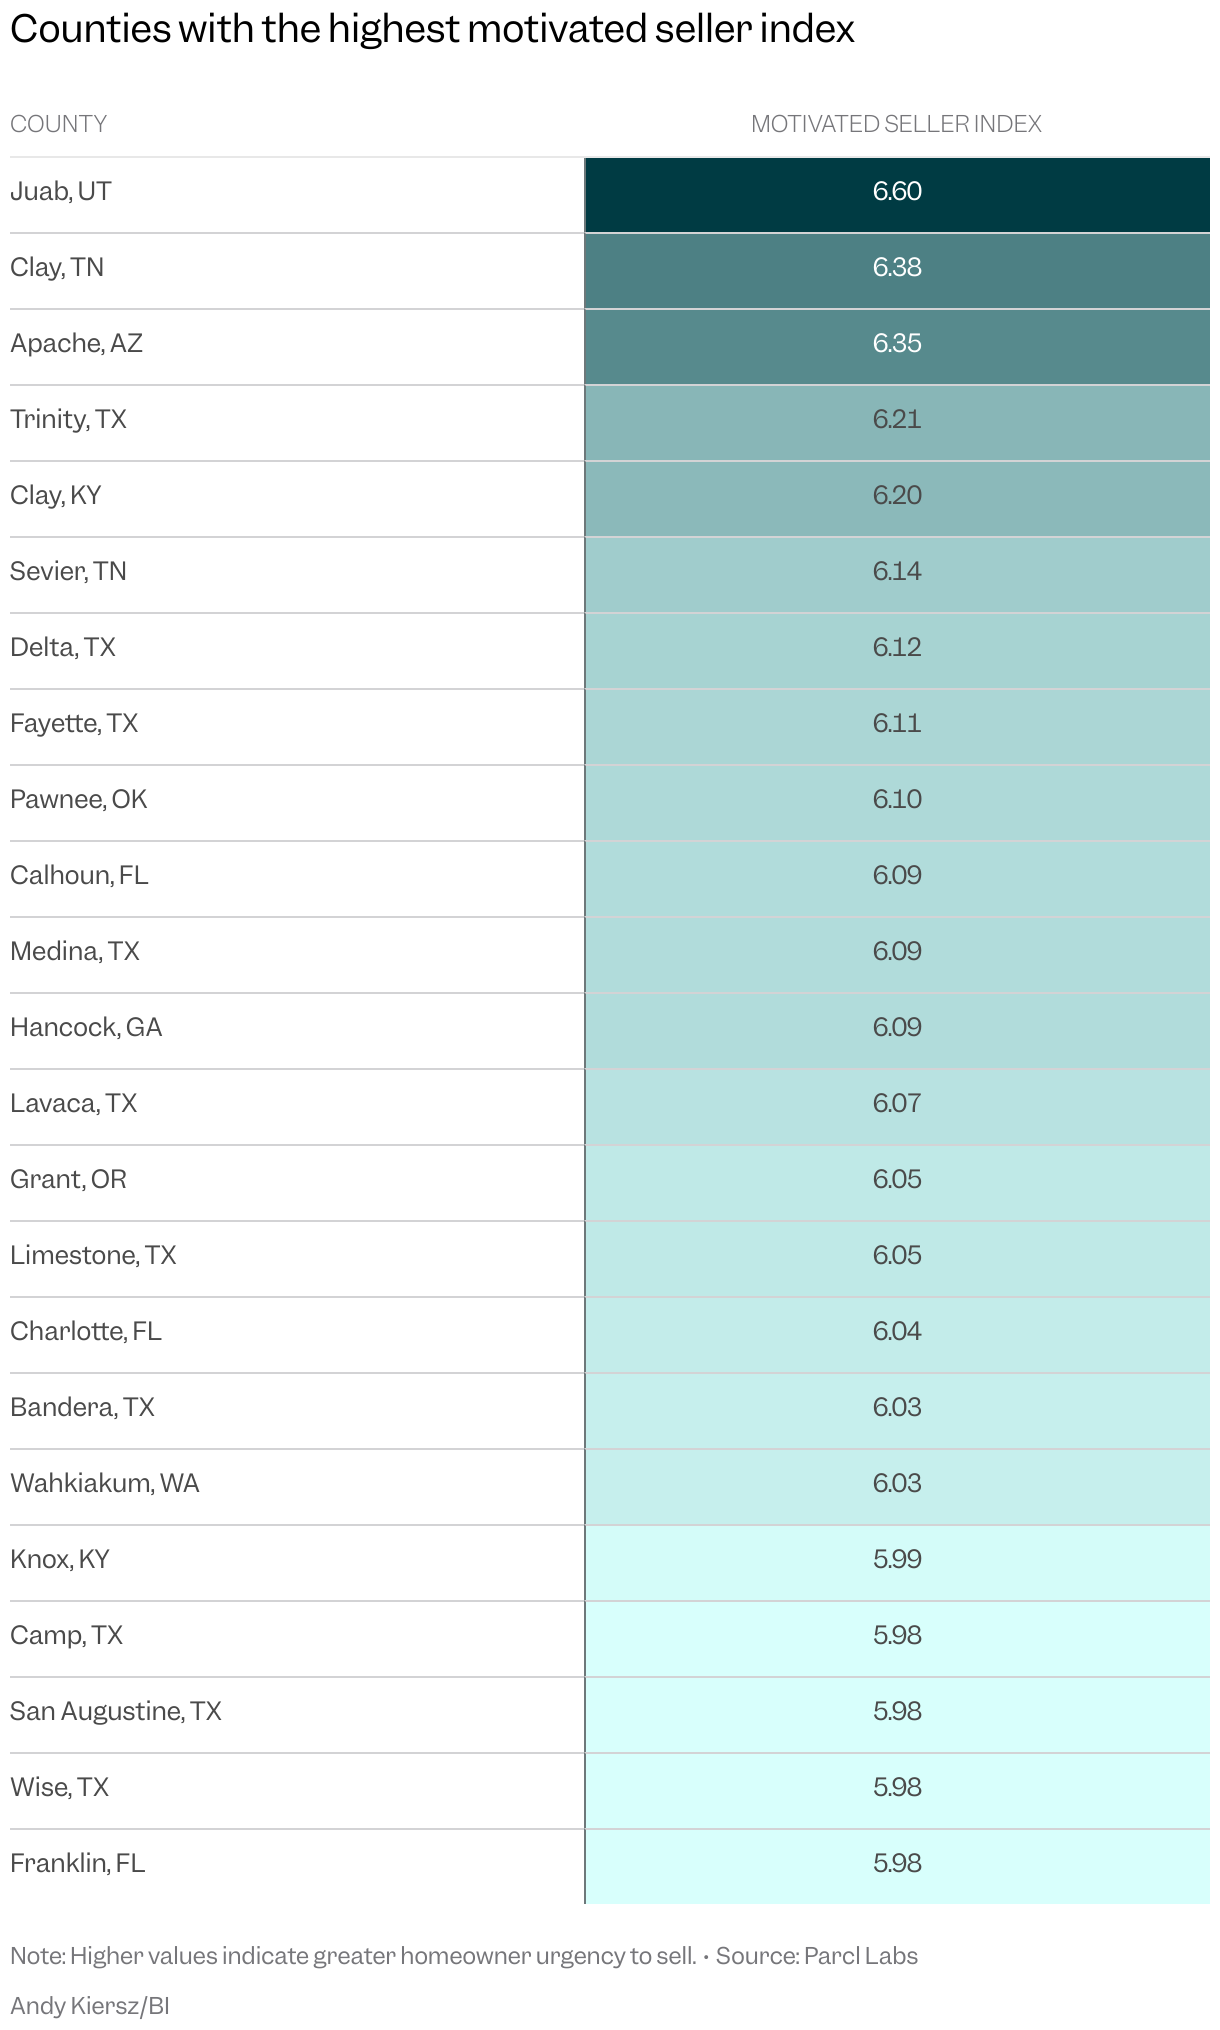
That’s just one metric. To gauge sellers’ desperation these days, Parcl Labs created what it calls the Motivated Sellers Index, which combines four factors: the number of price cuts on home listings, the time in between those cuts, the size of the price decreases, and the length of time homes are spending on the market. The higher the score, the greater the homeowners’ urgency to sell. The lower half of the US, with the exception of much of California, is awash in high scores, indicating sellers are ceding negotiating power to buyers. Same goes for much of the West. The Midwest and Northeast, on the other hand, registered some of the lowest scores in the nation: Sellers there are sitting pretty by comparison.
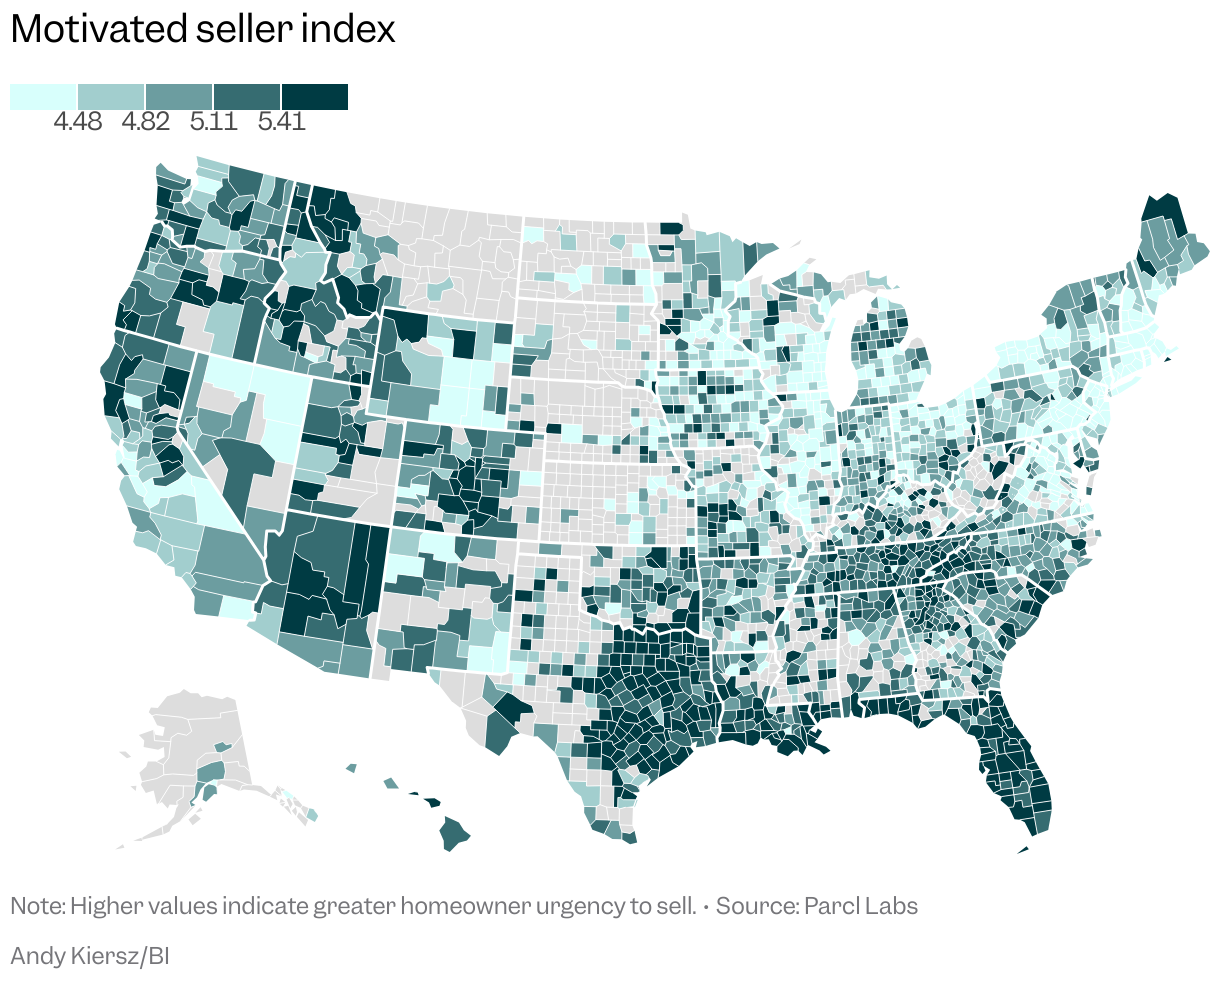
“We have declining home prices in many of these pandemic-winning housing markets,” Jason Lewris, a cofounder of Parcl Labs, tells me. “The sellers in many of those markets are very motivated to get out.”
That index, Lewris says, is a “pretty good proxy for where home prices may go.” In other words, an abundance of motivated sellers today likely spells more price drops in the future. If homeowners are dropping their prices to meet the market, it shows they’re not just testing the waters and hoping to get their dream amount.
In the summer of 2024, sellers appeared content to hold out for top dollar. This past summer, though, marked a notable uptick in seller motivation, says Lucy Ferguson, another executive at Parcl Labs.
Related stories
Business Insider tells the innovative stories you want to know
Business Insider tells the innovative stories you want to know
“Not only is there more stuff on the market, but there’s a lot more price cutting,” Ferguson tells me. “It’s kind of like sellers meeting reality. That’s the big theme.”
With mortgage rates still well above their pandemic-era lows, millions of households are playing the waiting game. Existing homeowners are unwilling (or unable) to give up their plum mortgage rates, so they’re delaying moves that they’d otherwise be making. Renters are hanging tight until the affordability math tilts in their favor. This helps explain why the relative level of demand is so much higher across the Midwest than somewhere like Texas or Florida. When people are stuck in place, the typical migration patterns break down. The South adds fewer new buyers, and the North holds onto more of them. The result is weaker price growth — or even falling prices — in places that were once dependable strongholds of rising home values.
“If I’m a young family in suburban Chicago or upstate New York, I would have bought my house from the guy who moved to Orlando,” Simonsen tells me. “But they didn’t sell, and I still need to buy.”
Not only is there more stuff on the market, but there’s a lot more price cutting. It’s kind of like sellers meeting reality.Lucy Ferguson, vice president of strategy at Parcl Labs
The labor market also points to a stuck-in-place economy. Unemployment is low, but hiring is way down. The “quits rate,” or percentage of workers voluntarily walking away from their jobs, is lagging. People are wary of making big life moves that could leave them in the lurch if things go wrong. To look for signs of thawing in the housing market, Simonsen tells me he’ll be watching for a pickup in the quits rate — if people are confident that they can leave their job and find a new one, it’s a good sign that they’re up for other major changes like a cross-country move. Until then, expect this reversal of the Covid-era winners and losers to hold.
“In a lot of these markets where home prices are kind of flat to lower, I don’t exactly see a reason why all of a sudden home prices are going to reaccelerate meaningfully,” McKeveny, the researcher at Zelman, tells me.
The Sun Belt is still a long way from “market crash” territory — even places like Austin are still adding people on a net basis, albeit at a much slower pace. But the price cuts represent a serious reality check. With the rise of Zoomtowns now a distant memory, buyers across the South and Mountain West benefit from more bargaining power than they’ve had in years. Their counterparts up north, on the other hand, still face stiff competition and rising prices. You can count on the pendulum to swing in the other direction once people start moving again. In the meantime, places like Cleveland and Buffalo will continue to enjoy prime position atop the housing-market heap.
James Rodriguez is a correspondent on Business Insider’s Discourse team.
Business Insider’s Discourse stories provide perspectives on the day’s most pressing issues, informed by analysis, reporting, and expertise.