A comprehensive DNA methylation reference of acute leukemia
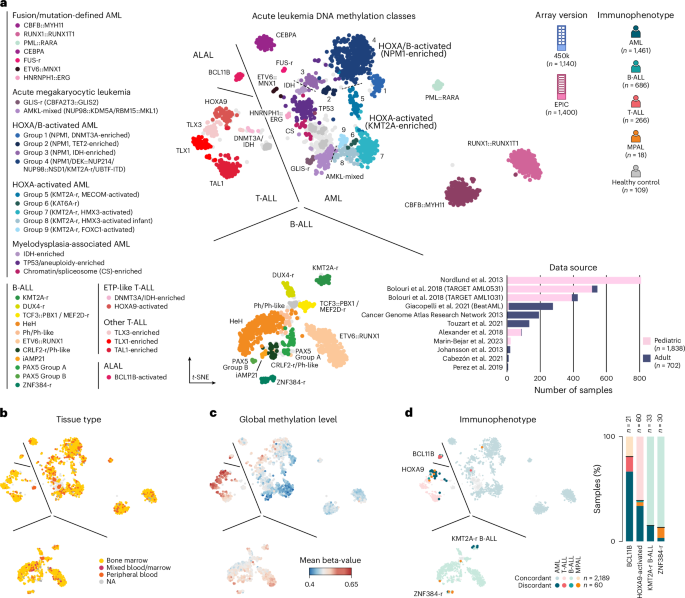
We curated a comprehensive DNA methylation-based reference cohort from published studies that encompasses the full diversity of acute leukemia lineages and molecular drivers (Fig. 1a). To this end, we assembled a dataset consisting of 2,540 high-quality samples from 11 published studies that used genome-wide 450k or EPIC DNA methylation arrays (Extended Data Fig. 1a,b and Supplementary Table 1)22,27,28,30,31,32,33,34,35,36,37. These data encompassed diagnostic samples from pediatric (n = 1,838) and adult (n = 702) patients, and included 1,461 AML, 686 B-ALL, 266 T-ALL and 18 mixed-phenotype acute leukemia (MPAL) samples as well as 17 bone marrow and 92 peripheral blood controls from healthy donors.
a, Overview of acute leukemia reference cohort shown as a t-SNE dimensionality reduction with samples colored by methylation class (n = 38). The legend at the left of the figure shows grouped methylation classes. Top right shows cohort composition by array version and immunophenotype; bottom right shows dataset origin, the number of samples per dataset and age group. b. t-SNE as in a colored by tissue type. c. t-SNE colored by average global methylation level. d. t-SNE colored by immunophenotype with concordant and discordant cases colored separately (left). Stacked bar plots showing the percentage of immunophenotypes for samples in methylation classes BCL11B-activated ALAL, HOXA9-activated T-ALL, KMT2A-r B-ALL and ZNF384-r B-ALL (right). NA, not available.
A t-distributed stochastic neighbor embedding (t-SNE) visualization of our methylation-based reference cohort revealed clear separation of acute leukemia samples according to lineage (Fig. 1a). The t-SNE visualization also showed discernible substructure within each lineage, indicating significant epigenetic heterogeneity within AML, B-ALL and T-ALL22,27,28. To further characterize this heterogeneity, we collected available pathology and molecular data for each sample and integrated annotations from prior studies. In total, we defined 38 distinct DNA methylation classes across AML (top right, n = 21), B-ALL (bottom, n = 11), T-ALL (middle left, n = 5) and ALAL (top left, n = 1; Fig. 1a, Extended Data Fig. 1c and Supplementary Table 2). Of these, 25 methylation classes (13 AML, seven B-ALL and five T-ALL) corresponded closely to classes defined in prior studies of individual acute leukemia lineages, and we therefore used these directly22,27,28,38. In addition, four methylation classes in B-ALL were produced by subdivision of published categories (Extended Data Fig. 1d,e), while nine methylation classes (eight AML, one ALAL) have not been previously described to our knowledge (Extended Data Fig. 1c,f). Samples without prior class annotations or with incomplete genetic data were assigned a methylation class by label propagation (Extended Data Fig. 1g–j; see Methods). Across methylation classes, we did not observe unexpected bias according to array version, tissue type or sex (Fig. 1b and Extended Data Fig. 1b,k). T-ALL classes generally showed a more hypermethylated epigenome, while AML classes were more hypomethylated, in agreement with previous reports (Fig. 1c)39.
We next assessed the accuracy of DNA methylation profiling for acute leukemia lineage assignment. Overall, methylation-based classification showed high concordance with immunophenotypic evaluation, assigning an identical lineage in 2,189 out of 2,249 (97.3%) cases (Fig. 1d). AML, B-ALL and T-ALL showed lineage concordance in 96.7%, 99.7% and 98.4% of cases, respectively, and we did not observe a difference in lineage concordance between adult and pediatric cases (98.0% and 97.1%, respectively; Extended Data Fig. 2a). By contrast, MPAL were reclassified to a single lineage in ten out of 14 (71.4%) cases. Among lineage discordant cases, the majority (49 out of 60, 81.6%) localized to methylation classes characterized by molecular alterations with known lineage ambiguity, including BCL11B-activated ALAL (n = 17), HOXA9-activated T-ALL (associated with PICALM::MLLT10, n = 23) and ZNF384-r and KMT2A-r B-ALL (n = 4 and n = 5, respectively; Fig. 1d and Extended Data Fig. 2b,c). In these cases, methylation classes mostly reflected the underlying molecular driver rather than the lineage defined by immunophenotype. Specifically, nearly all samples in our cohort with genetic alterations in BCL11B, PICALM::MLLT10 and ZNF384-r were assigned to the associated methylation class (eight out of eight BCL11B ALAL, 11 out of 11 PICALM::MLLT10 T-ALL and 23 out of 24 ZNF384-r B-ALL; Extended Data Fig. 2d–f). Together, these findings support DNA methylation profiling as a valuable approach to assign acute leukemia lineages and identify patients with rare or cryptic alterations associated with lineage ambiguity.
DNA methylation resolves disease heterogeneity in AML
We next examined disease heterogeneity within specific acute leukemia lineages in more detail. As noted above, we did not identify considerable additional heterogeneity in T-ALL and B-ALL in addition to that reported previously (Extended Data Fig. 1c)22,28,38. However, our meta-analysis in AML included twice the number of samples (n = 1,289) analyzed in any prior methylation-based study (n = 649) and included substantial representation of pediatric (n = 825) and adult (n = 464) cases (Supplementary Table 3). We therefore focused on a detailed characterization of methylation classes in AML, in which we found eight new methylation classes and refined several others.
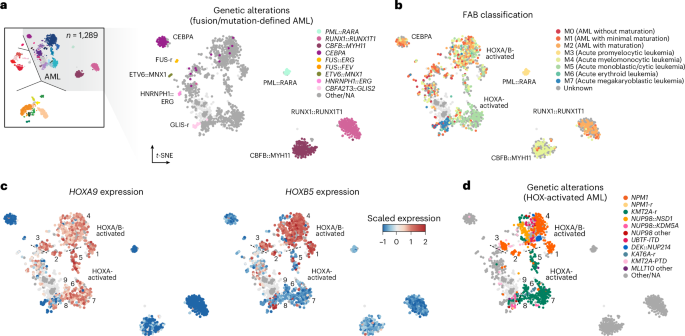
DNA methylation profiles of tumor samples reflect the epigenetic state of their cellular origin and changes acquired during tumorigenesis40,41,42,43. Therefore, we reasoned that AML methylation classes would reflect known molecular categories or disease subtypes but also resolve heterogeneity not captured in current classification schemes2,3,6,8. Consistent with this reasoning, eight out of 21 AML methylation classes were defined by specific genetic drivers, including seven classes (PML::RARA, RUNX1::RUNX1T1, CBFB::MYH11, FUS-r, ETV6::MNX1, HNRNPH1::ERG and GLIS-r) defined by specific gene fusions and one class defined by mutations in CEBPA (Fig. 2a and Extended Data Fig. 3a). These eight methylation classes captured nearly all cases in our retrospective cohort with the corresponding genetic alterations (407 out of 426, 95.5%) and showed expected patient age distributions, survival outcomes and differentiation patterns per French–American–British (FAB) categories (Fig. 2b and Extended Data Fig. 3b–d). Among the few cases with these genetic alterations that localized outside their expected methylation class (one out of 155 RUNX1::RUNX1T1, two out of 143 CBFB::MYH11, 13 out of 64 CEBPA-mut and three out of 19 GLIS-r), competing genetic drivers were present in most cases. Specifically, all (13 out of 13) cases with CEBPA mutations outside the CEBPA methylation class harbored co-occurring alterations in additional leukemia-associated genes (including NPM1 (n = 4), IDH1/2 (n = 3), TP53 (n = 1), genes associated with myelodysplasia-related changes (n = 4), NUP98 (n = 2) and FLT3 (n = 3); Extended Data Fig. 4a,b and Supplementary Table 4). Moreover, 11 out of 13 samples (84.6%) lacked canonical bZIP in-frame insertions and deletions (indels), and no sample had bi-allelic mutations (zero out of five samples with available information). Therefore, these cases would not be categorized as prognostically favorable CEBPA-mutated AML by recent classification schemes2,3,44,45. Consistently, these cases were associated with worse outcomes compared to those within the CEBPA methylation class (log-rank test, P = 7.2 × 10⁻⁴ in adult cohorts, P = 0.019 in pediatric cohorts; Extended Data Fig. 4c,d). These data closely match similar findings in the transcriptome space46.
a, Subsection of the t-SNE dimensionality reduction as in Fig. 1a showing only AML classes, with cases colored by methylation class-defining genetic alterations. b, t-SNE as in a, colored for FAB classification. c, t-SNE as in a, colored for expression of HOXA9 (left) and HOXB5 (right). d, t-SNE as in a, colored for genetic alterations common to HOX-activated AML.
By contrast, most remaining AML methylation classes were not defined solely by genetics. For example, we identified three methylation classes (IDH-enriched, chromatin/spliceosome-enriched and TP53/aneuploidy-enriched) associated with older age and myelodysplasia-related changes, which localized close to normal controls and encompassed multiple distinct but biologically related alterations. (Extended Data Figs. 3b,c and 4e–h and Supplementary Table 5). As another example, we identified nine AML methylation classes defined by expression of HOXA9 and HOXB5 (groups 1–4) or expression of HOXA9 alone (groups 5–9; Fig. 2c and Extended Data Fig. 5a–c). HOXA/B-activated methylation classes were highly enriched for NPM1-mut, while HOXA-activated classes were defined by KMT2A-r, and each showed expected associations with monocytic differentiation (FAB M4/M5; Fig. 2d and Extended Data Fig. 3a)47. However, NPM1-mut and KMT2A-r were found across several distinct HOX methylation classes, suggesting that epigenetic profiling can complement and refine disease heterogeneity revealed by orthogonal genetic and transcriptional studies. Of note, activating mutations in FLT3, an indication for targeted therapy in AML, were also enriched in several HOXA/B-activated methylation classes but were not class-defining on their own (Extended Data Fig. 4b). In summary, these findings highlight how epigenetic states reflect established molecular categories in acute leukemia but can also reveal disease heterogeneity or shared biology that is not captured by conventional testing alone.
Epigenetic heterogeneity in HOX-activated AML
We next sought to characterize heterogeneity in HOX-activated AML methylation classes in greater detail. This analysis was of particular interest given the emergence of menin inhibitors for patients with KMT2A-r and NPM1-mutant AML, which show high expression of HOXA and HOXA/B-cluster genes, respectively, and reports describing menin sensitivity in less common acute leukemia subtypes with HOX activation (for example, NUP98-r, UBTF-ITD)48,49,50,51. Detection of these genetic alterations with standard-of-care workflows requires multiple specialized assays (targeted sequencing, karyotyping, FISH) and carries the risk of missing cryptic or rare alterations52,53. We therefore considered whether methylation-based assessment could detect HOX activation status and heterogeneity directly.
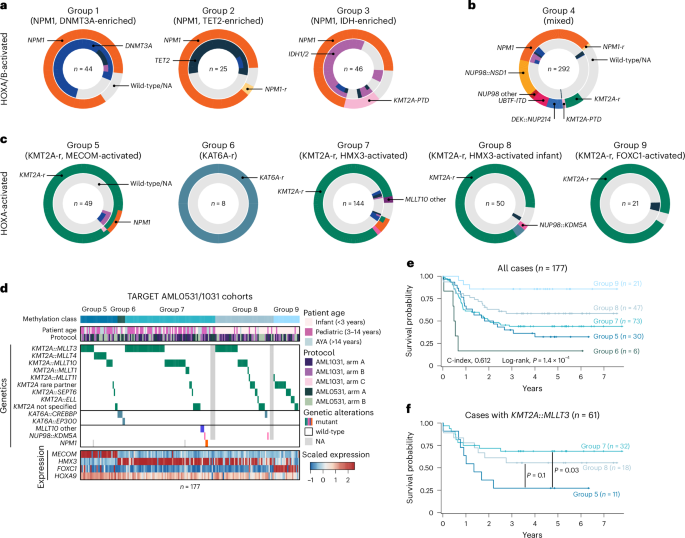
HOXA/B-activated groups 1–3 harbored frequent mutations in NPM1 (92.7%, 88.0% and 76.7% of cases, respectively) and were enriched for group-specific co-mutations in DNMT3A (group 1, n = 33 out of 37), TET2 (group 2, n = 14 out of 20) and IDH1 or IDH2 (group 3, n = 30 out of 32; Fig. 3a)27. HOXA/B-activated group 4 was more diverse, with primary genetic alterations spanning categories often associated with favorable prognosis, such as NPM1 mutations (n = 102, 34.9%), to those associated with unfavorable prognosis, such as NUP98::NSD1 (n = 45, 15.4%) or other NUP98 fusions (n = 6, 2.1%), KMT2A-r (n = 22, 7.5%), KMT2A-PTD (n = 4, 1.4%), DEK::NUP214 (n = 20, 6.8%) and UBTF-ITD (n = 18, 6.2%; Fig. 3b)6. Similar to KMT2A-r and NPM1-mut, NUP98-r, DEK::NUP214 and UBTF-ITD leukemias are all characterized by elevated HOX expression48,53,54,55,56.
a, Pie charts showing genetic alterations for samples in HOX groups 1 (left), 2 (middle) and 3 (right). Primary mutations (for example, in NPM1) are indicated in the outer circle, while co-mutations in TET2, IDH1, IDH2 and DNMT3A are indicated in the inner circle. b, Pie chart as in a for samples in HOXA/B-activated group 4. c, Pie charts as in a, but for samples in HOXA groups 5–9. d, Oncoplot showing genetic alterations, clinical characteristics and expression of key genes across HOX groups 5–9 in samples from the TARGET AML0531 and AML1031 studies. e, Kaplan–Meier plot showing all cases in HOX groups 5–9 stratified by methylation class. Log-rank test P value is shown. f, Kaplan–Meier plot showing KMT2A::MLLT3 cases in HOX groups 5, 7 and 8 stratified by methylation class. Log-rank test P values are shown, without adjustment for multiple comparisons.
Of note, 72 samples (24.7%) within HOXA/B-activated group 4 were without a known genetic driver mutation. Of those samples, 60 were wild-type for NPM1 and had a karyotype that did not show evidence of HOX-activating translocations, while 12 had missing information (Fig. 3b and Supplementary Table 3). However, 52 out of 54 (95.2%) samples with available gene expression data had strong expression of HOXA9 and HOXB5, comparable to group 4 cases for which HOX-activating driver mutations were detected (Extended Data Fig. 5b). These results suggest that methylation-based classification could provide a valuable proxy for HOX-activated leukemia. This information could be used to focus subsequent analysis to identify rare or cryptic drivers with validated sensitivity to menin inhibitors or, in a research setting, identify previously unrecognized mechanisms of HOX activation.
HOXA-activated groups 5, 7, 8 and 9 had KMT2A rearrangements in 100%, 90.6%, 93.5% and 95.0% of samples, respectively, while all group 6 samples (eight out of eight, 100%) harbored rearrangements of KAT6A (Fig. 3c). Interestingly, we found that methylation classes were not defined by specific KMT2A fusion partners (Fig. 3d). To better understand the similarities and differences between groups 5–9, we jointly analyzed available genetic, transcriptional and clinical data. We focused on the TARGET AML0531 and AML1031 trials, the two most homogenous AML datasets of adequate size available for analysis. Transcription data revealed class-specific expression patterns of MECOM in group 5, HMX3 in groups 6–8 and FOXC1 in group 9 (Extended Data Fig. 5d–f and Supplementary Table 6)57,58,59. Groups 5–7 represented patients of all age groups, while patients in groups 8 and 9 were almost exclusively below the age of 3 years.
Retrospective analysis of survival data showed differential outcomes between HOX groups 5–9 in the AML0531 and AML1031 cohorts (log-rank test, P = 1.4 × 10⁻⁴, C-index, 0.612; Fig. 3e and Extended Data Fig. 5g). Group 6 (KAT6A-r) and group 5 (MECOM-activated KMT2A-r) showed the poorest survival (median overall survival of 0.51 years and 2.01 years, respectively), while group 9 (FOXC1-activated KMT2A-r) displayed more favorable outcomes (median overall survival not reached). Finally, we asked whether stratification by methylation class could explain outcome heterogeneity for specific KMT2A fusion partners. We specifically investigated KMT2A::MLLT3, the most common KMT2A rearrangement in AML, which shows intermediate survival among pediatric patients (Extended Data Fig. 5h)60. When further stratified by methylation class, our analysis suggests that patients in group 5 (MECOM-activated KMT2A-r) are associated with worse survival than patients in HOXA-activated groups 7 and 8 (P = 0.03 and P = 0.1, respectively; Fig. 3f).
In summary, our results indicate that epigenetic classification, in concert with standard-of-care genetic approaches, could help identify patients with HOX-activated acute leukemia, including those driven by rare or unknown genetic alterations. In some cases, HOX-associated methylation classes may provide an additional layer of information that refines risk stratification based solely on genetics. However, implications for clinical outcomes and treatment, including how to best integrate methylation-based classification with standard-of-care approaches, must be studied in larger cohorts and is an important direction for future research.
A neural network for epigenetic acute leukemia classification
Based on our reference cohort, we next aimed to create a machine learning model to predict methylation classes for query cases profiled using different epigenomic profiling technologies, including low-coverage whole-genome nanopore sequencing. The feasibility of methylation class prediction from sparse sequencing data has recently been demonstrated for central nervous system tumors17,18,19,61,62. These studies motivated our approach to develop MARLIN, a neural network-based classifier for acute leukemia (Fig. 4a). Network architecture includes all 357,340 high-quality methylation array probes as an input layer, two fully connected hidden layers and an output layer providing confidence scores for each of the 38 acute leukemia methylation classes and four control classes (Fig. 4b). To enable accurate predictions from shallow sequencing, several adaptations were made during model development, including random removal of 99% of input cytosine–phosphate–guanine (CpG) sites during each training epoch (see Methods).
a, Schematic of MARLIN training and performance estimation. Cutout shows the reference cohort from Fig. 1a. Reference methylation array beta values are binarized, 50 samples for each class are randomly selected and 10% artificial noise is added to the data. Fivefold cross-validation is performed to estimate model performance at different levels of sparsity in the test sets. b, Schematic depicting MARLIN neural network architecture. The network is composed of an input layer equal to the number of probes in the reference (357,340), two hidden layers with 256 and 128 nodes and a final layer for the multiclass classification represented by 42 nodes. A 99% dropout is applied to the input layer only during training at each epoch (left). MARLIN generates scores corresponding to methylation class probabilities. Scores sum up to 1 across classes (right). Methylation class colors are the same as in Fig. 1a.
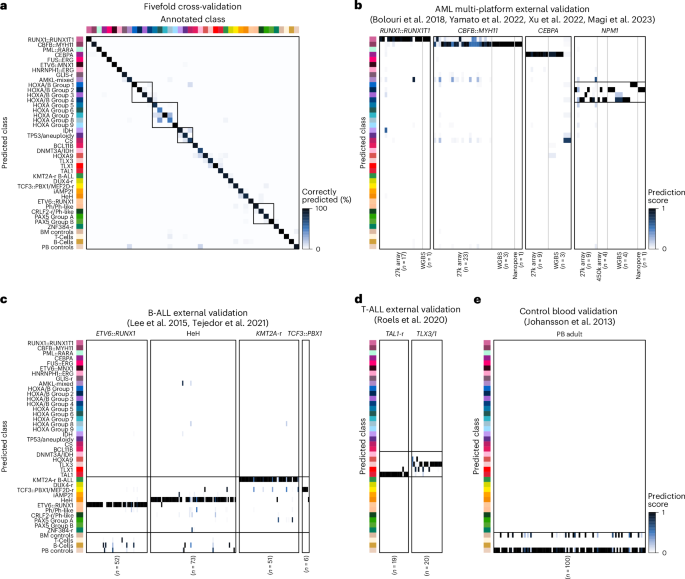
To evaluate our model, we performed fivefold cross-validation analysis of the training dataset (Fig. 5a). Using all CpGs, MARLIN showed high precision in distinguishing acute leukemia lineages (2,324 out of 2,356 cases, median F1 score of 0.99 across lineages) and methylation classes (2,175 out of 2,356 cases, median F1 score of 0.91, range of 0.63–1.00; Extended Data Fig. 6a,b). Of 181 misclassified cases, 31 (17.1%) had high prediction scores for control classes, suggesting low tumor-cell content. Misclassifications otherwise occurred between closely related methylation classes, such as HOXA-activated (n = 26, 14.3%) and HOXA/B-activated AML (n = 18, 9.9%). Therefore, we grouped closely related classes into methylation class families, reasoning that this would allow us to increase the predictive confidence for biologically similar classes (Supplementary Table 2 and Methods). Introduction of methylation class families resulted in a median F1 score of 0.96 in cross-validation (2,232 out of 2,356 cases, F1 score range of 0.78–1.00; Extended Data Fig. 6c).
a, Confusion matrix obtained during the fivefold cross-validation, using all available methylation values. Rectangles represent methylation class families HOXA, HOXA/B, myelodysplasia AML and Ph/PAX5 B-ALL. b, Heatmap showing multi-platform external validation of acute leukemia cases driven by specific genetic alterations. Samples were profiled by 27k array (n = 58), 450k array (n = 4), whole-genome bisulfite sequencing (WGBS; n = 11) or nanopore sequencing (n = 2). c, Heatmap showing external validation of B-ALL cases associated with class-defining genetic alterations (n = 182). The color scale indicates MARLIN prediction scores. All samples were profiled using 450k arrays. d, Heatmap showing external validation of T-ALL cases (n = 39). e, Heatmap showing MARLIN predictions for healthy blood controls (n = 100). PB, peripheral blood.
We next evaluated MARLIN performance by simulating different levels of sparsity (ranging from 0% to 99%) using random subsets of available CpGs. In fivefold cross-validation, we found that classification performance remained high for methylation class, family and lineage (median F1 scores of 0.91, 0.95 and 0.99, respectively) at simulated sparsity levels up to 97% (corresponding to 10,720 CpGs; Extended Data Fig. 6d–f). We found that a classification threshold of 0.8 offered a viable compromise between sensitivity and specificity across different levels of sparsity (Extended Data Fig. 6g).
We further validated the ability of MARLIN to use data from different DNA methylation profiling technologies with varying levels of sparsity. We first analyzed data from 75 AML samples profiled with 27k and 450k methylation arrays, whole-genome bisulfite sequencing and nanopore sequencing (n = 58, n = 4, n = 11 and n = 2, respectively; Supplementary Table 7)29,30,63,64. For 450k, whole-genome bisulfite sequencing and nanopore sequencing, 12 out of 13 (92.3%) samples reached high scores for the associated methylation class (Fig. 5b). Predictions for the 27k array were concordant in 52 out of 58 (89.7%) samples but showed lower overall prediction scores, possibly because of a limited number of informative probes or other data quality-related effects. Additional validation was performed in 321 B-ALL, T-ALL and healthy control samples profiled with 450k methylation arrays26,35,65,66. Using MARLIN, 156 out of 182 (85.7%) B-ALL, 36 out of 39 (92.3%) T-ALL and 100 out of 100 (100%) controls received the highest prediction scores that were consistent with reported annotations (Fig. 5c–e and Supplementary Tables 8–10). Overall, these results show that MARLIN effectively identifies different acute leukemia lineages, methylation families and classes. Moreover, the performance of our neural network on sparse methylation data demonstrates that MARLIN successfully learned to rely on a limited number of informative probes without compromising classification performance.
Acute leukemia classification from nanopore sequencing data
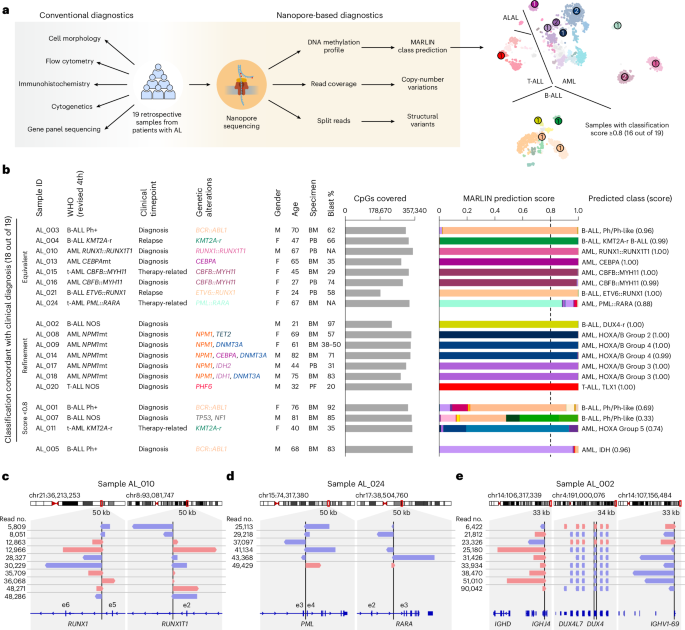
Having established that MARLIN accurately predicts acute leukemia classes from external DNA methylation datasets, we next performed nanopore sequencing on a retrospective cohort of 19 acute leukemia samples (n = 11 AML, n = 7 B-ALL, n = 1 T-ALL) harboring diverse genetic alterations and ranging from 21 to 82 years in age (median, 65 years; Fig. 6a, Extended Data Fig. 7a and Supplementary Table 11). All samples were sequenced on individual MinION runs with flow cell reloading to maximize total read output (Extended Data Fig. 7b, Supplementary Table 12 and Methods).
a, Overview of the retrospective acute leukemia patient cohort (n = 19). Patients previously underwent conventional diagnosis (left) and were subjected to nanopore profiling and MARLIN classification (right). b. Bar plots show the number of covered reference CpGs and MARLIN prediction scores for 19 samples of the retrospective acute leukemia cohort. Patient characteristics are indicated in the table on the left. Methylation classes with the highest score are indicated on the right. The top eight rows represent samples for which nanopore profiling resulted in a concordant methylation class that was equivalent to the clinical diagnosis. The subsequent seven rows represent samples for which MARLIN analysis resulted in a refinement of the clinical diagnosis. Analysis of the next three samples did not yield a clear methylation class prediction (score of <0.8). However, methylation classes with the highest scores were concordant with clinical diagnosis, and lineage and/or methylation class family predictions were obtained with high confidence. The bottom row represents a sample for which MARLIN analysis yielded a discordant methylation class prediction with high confidence. c, IGV visualization of reads supporting a RUNX1::RUNX1T1 fusion in AL_010. Reads are sorted by sample ID and colored by strand. d, IGV visualization as in c but for PML::RARA in AL_024. e, IGV visualization as in c but for DUX4-r in AL_002. Multiple copies of DUX4 exist in a repeat array on chromosome 4. Only one copy of DUX4 is translocated to the IGH locus. t-AML, therapy-related AML; BM, bone marrow; PF, pericardial fluid.
Among cases that received a high-confidence prediction (≥0.8), 15 out of 16 (93.8%) were concordant with results from conventional pathology evaluation, including ten AML, five B-ALL and one T-ALL case (Fig. 6b and Supplementary Table 13). In two cases of fusion-defined AML (AL_010 and AL_024), additional high-coverage nanopore sequencing with the PromethION platform confirmed underlying RUNX1::RUNX1T1 and PML::RARA fusions, consistent with clinical cytogenetic testing and the predicted methylation classes (Fig. 6c,d). In one case (AL_014) harboring three non-canonical CEBPA mutations (that is, not bZIP in-frame indels) and co-mutations in NPM1 and DNMT3A, MARLIN assigned a HOXA/B-activated group 4 rather than CEBPA methylation class, in agreement with prior observations in our reference cohort (Extended Data Figs. 4a and 7c). MARLIN also resulted in refined classifications in cases of AML with mutated NPM1, which were classified as HOXA/B-activated methylation classes in a manner consistent with their observed co-mutation patterns, including HOXA/B-activated group 2 (AL_008, co-mutation in TET2) and HOXA/B-activated group 3 (AL_017 and AL_018, co-mutations in IDH2 and IDH1, respectively; Fig. 6b). In one case of B-ALL not otherwise specified (AL_002), MARLIN refined the molecular classification and led to the discovery of a cryptic genetic driver with prognostic importance. Classification showed a high score (1.00) for the B-ALL DUX4-r methylation class. We confirmed the cryptic DUX4 translocation with high-coverage nanopore sequencing (Fig. 6e).
In one case (AL_005), methylation-based classification (0.96 for AML IDH-enriched) was discordant with the clinical diagnosis of Ph+ (p190) B-ALL. This sample was from a 68-year-old male who experienced a sustained remission following tyrosine kinase inhibitor and blinatumomab therapies and subsequent bone marrow transplantation. Further investigation did not identify hotspot mutations in IDH1 or IDH2 that would explain the lineage discordance, although examination of copy-number profiles revealed losses of chromosomes 7q and 16q, which can be seen in myeloid-lineage neoplasms, and flow cytometry reported aberrant co-expression of myeloid antigens CD13 and CD33 on B-ALL cells (Extended Data Fig. 7a,d). Finally, in three out of 19 cases, MARLIN yielded a confidence score less than 0.8; however, all of these cases still showed dominant predictions at the level of methylation class (AL_011, 0.74 for AML HOXA-activated group 5; AL_001, 0.69 for B-ALL Ph/Ph-like) or methylation class family (AL_007, 0.84 for B-ALL Ph/PAX5) that were concordant with the pathology diagnosis (Fig. 6b).
To extend our validation, we analyzed 15 additional retrospective cases, including ten AML, four B-ALL and one MPAL (Extended Data Fig. 8a–c and Supplementary Table 14). These samples were profiled using multiplexed sequencing on the PromethION platform. Of cases that received a high-confidence MARLIN prediction (≥0.8), ten out of ten (100%) were concordant with results from conventional pathology evaluation, including three cases that received a more refined molecular classification (AL_028, B-ALL PAX5 group B; AL_033, AML IDH-enriched; and AL_027, AML TP53/aneuploidy-enriched). Among cases that did not receive a high-confidence prediction, three out of five had dominant classes that were in agreement with pathology results (AL_029, AL_036 and AL_039). The two remaining cases received dominant class predictions of bone marrow controls (AL_030) and mixed T cells and lineage-concordant acute leukemia classes (AL_034), possibly because of low tumor purity (blast counts 10% and 22%, respectively). None of the cases profiled in this validation set received a discordant prediction.
Finally, we also tested MARLIN on samples from healthy donors and patients with myelodysplastic syndromes (MDS), a precursor state to AML that was not included in our reference cohort. Of ten samples profiled from healthy donors (four bone marrow, six whole blood), all were predicted as control methylation classes (Extended Data Fig. 8d and Supplementary Table 15). Among six MDS cases, two received high scores for the AML TP53/aneuploidy-enriched methylation class, while two were predicted as control classes and two received low scores for other myelodysplasia-related methylation classes (AML IDH-enriched, AML Chromatin/spliceosome-enriched; Extended Data Fig. 8e, Supplementary Table 16). These results suggest shared epigenetic features between MDS and MDS-associated AML and highlight the limitations of applying MARLIN to cases that have not met criteria for acute leukemia by standard-of-care methods. In summary, our findings indicate that MARLIN, coupled with nanopore sequencing of clinical samples, can correctly classify acute leukemia subtypes, achieving concordant diagnoses in 25 out of 26 (96.2%) cases that achieved high-confidence prediction scores across our two validation cohorts.
MARLIN for real-time acute leukemia classification
Having established our framework for retrospective samples, we evaluated whether classifications could be obtained in a rapid manner through real-time analysis of nanopore sequencing data17,18,19. As a proof of concept, we used MARLIN to simulate real-time methylation class predictions with sequencing data from our initial retrospective nanopore cohort. Comparing simulated real-time predictions to results obtained with the full dataset, we found that 14 out of 16 confidently predicted cases reached an identical classification (prediction score of ≥0.8) in less than 1 h of sequencing (Extended Data Fig. 9a,b). We next implemented MARLIN locally as an automated workflow on a GridION sequencer to generate methylation class predictions in real-time (see Methods). To test our workflow, we re-sequenced sample AL_016 and obtained a concordant classification after just 50 min of sequencing (Extended Data Fig. 9c).
We next applied MARLIN for real-time, prospective analysis of research-consented samples from five patients presenting with suspected acute leukemia at our institution (Supplementary Table 11). The first case (RTC_001) was a 61-year-old female with leukocytosis (63 × 106 l−1) and 50% peripheral blasts (Fig. 7a). After 56 min of sample processing and 40 min of nanopore sequencing, we obtained a high-confidence (≥0.8) MARLIN prediction for the AML TP53/aneuploidy-enriched class (Fig. 7b and Supplementary Table 17). In parallel, conventional diagnostic assays were performed that arrived at a diagnosis of AML with mutated TP53 after 4 days, in agreement with the MARLIN classification (Fig. 7c–e and Extended Data Fig. 9d–f). Subsequently, additional high-coverage nanopore sequencing confirmed the TP53 mutation and complex karyotype identified by clinical testing (Fig. 7f).
a, Timeline for patient RTC_001 from sample collection to diagnosis using rapid epigenomic classification (left) and conventional diagnostics (right). CNV, copy-number variation. b, Line graph showing real-time MARLIN prediction scores. Lines and colors correspond to different methylation classes; dashed lines show a probability threshold at 0.8. A classification was obtained after 40 min of sequencing. Methylation class colors are the same as in Fig. 1a. c, Images show Wright–Giemsa staining of diagnostic bone marrow aspirate (n = 1) and zoom in on blasts (left). Image on the right shows hematoxylin and eosin (H&E) staining of the same bone marrow core biopsy. Scale bars, 10 μm (Wright–Giemsa) and 20 μm (H&E). d, Flow cytometry plot showing results for blast population identification based on the expression of myeloid markers CD13 and CD34. Complete gating strategy is provided in Extended Data Fig. 9d. e, Images showing immunohistochemistry analysis of diagnostic bone marrow core biopsy stained for CD34 (n = 1) and P53 (n = 1). Scale bars, 20 μm. f, Copy-number variation profile obtained after 72 h of nanopore sequencing. Dots represent bins of 1 Mb in size, and orange lines represent genomic segments.
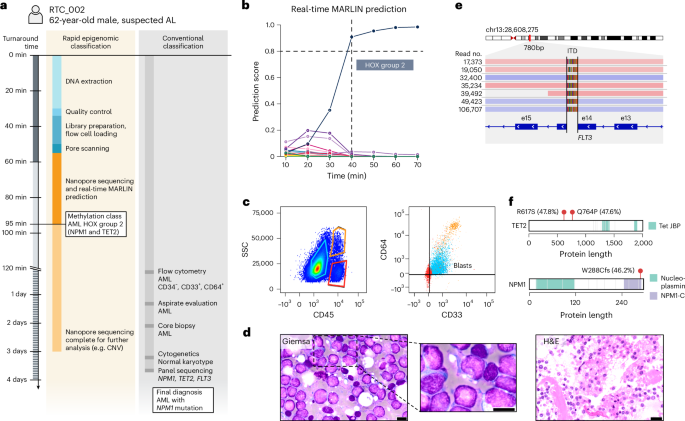
The second case (RTC_002) was a 62-year-old male with hyperleukocytosis (238 × 109 l−1; Fig. 8a). After 55 min of sample preparation and 40 min of sequencing, MARLIN generated a high-confidence prediction for the AML HOXA/B-activated group 2 (NPM1/TET2-enriched) methylation class (Fig. 8b and Supplementary Table 18). Results of conventional diagnostic testing after 3 days showed AML with monocytic differentiation (M5), blasts with cup-shaped nuclei and NPM1, TET2 and FLT3-ITD mutations, in agreement with our MARLIN classification (Fig. 8c–f and Extended Data Fig. 9g–i). Similar observations were made for prospective cases three to five, which received confident classifications for the HOXA/B-activated group 3 AML (after 590 min), the HOXA9-activated T-ALL (after 96 min) and the AML Chromatin/spliceosome-enriched methylation classes (after 135 min), compatible with subsequent pathology results and genetic analyses (Extended Data Fig. 10a–c). In conclusion, we provide proof of concept for rapid acute leukemia diagnosis in the clinic, highlighting the potential of MARLIN and nanopore sequencing to greatly accelerate diagnostic workflows for patients presenting with acute leukemia.
a, Diagnostic timeline for patient RTC_002. b, Line graph showing MARLIN prediction scores. A classification was obtained after 40 min of sequencing. c, Flow cytometry plots showing blast population identification based on SSC-A and CD45 expression and myeloid markers CD33 and CD64 expression. CD33high/CD64high cells (orange) represent mature monocytes; CD33low/CD64low cells (red) represent mature lymphocytes, CD33dim/CD64dim cells represent a blast population of monocytic origin (blue). Complete gating strategy is provided in Extended Data Fig. 9g. SSC, side scatter. d, Images show diagnostic Wright–Giemsa staining (n = 1) and H&E staining (n = 1) of the bone marrow core biopsy. Scale bars, 10 μm (Wright–Giemsa) and 20 μm (H&E). e, IGV visualization showing nanopore reads supporting a FLT3 internal tandem duplication (ITD). f. Protein paints of TET2 (top) and NPM1 (bottom) showing mutations detected using gene panel sequencing. Variant allele frequencies are indicated in brackets. Fill colors of the protein paint indicate protein domain.
Source link
