The 12-month overall PCE & core PCE price indices, which the Fed uses for its target, are worse than a year ago.
By Wolf Richter for WOLF STREET.
Inflation is in services, where it accelerated further, even in the inflation index that the Fed prefers, the PCE Price Index released today by the Bureau of Economic Analysis, though Powell has been denying it in recent speeches, blaming instead imported goods and tariffs for the current inflation impetus. But the PCE price index for durable goods, many of which are tariffed, fell (negative readings) in August for the second month in a row, while inflation in services, which are not tariffed, accelerated further.
Both the overall PCE price index and the core PCE price index accelerated further year-over-year, and their increases (+2.7% and +2.9%) are now worse than a year ago.
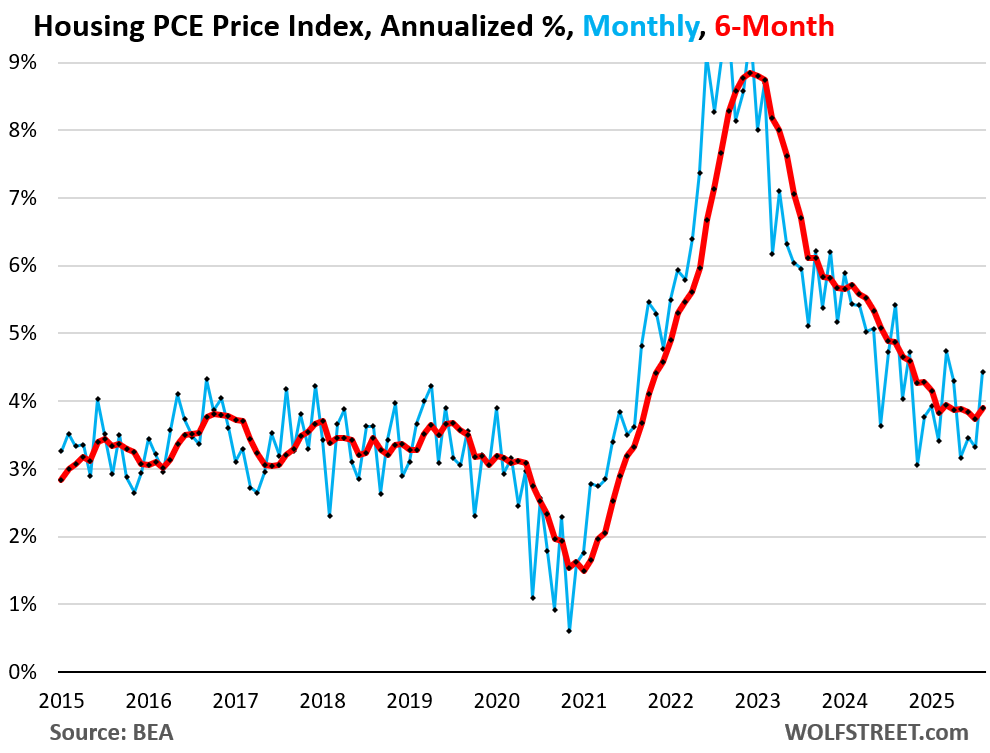
The core services PCE Price Index, which excludes energy services, accelerated to +0.34% (+4.1% annualized) in August from July, the fourth month in a row of acceleration. The increase was driven by rents (+4.4% annualized, the worst since March) and some non-housing services (blue in the chart). The 3-month index accelerated to 3.5% annualized, the worst since March (red).

This confirms what we have already seen in the primary inflation index of the US, the CPI, whose August data were released earlier in September by the Bureau of Labor Statistics: the month-to-month increase of core services was above 4% annualized for the second month in a row, the worst since January.
Rent inflation jumped in August, increasing by 4.4% annualized from July. The six-month index ticked up to 3.9%, the worst increase since March.
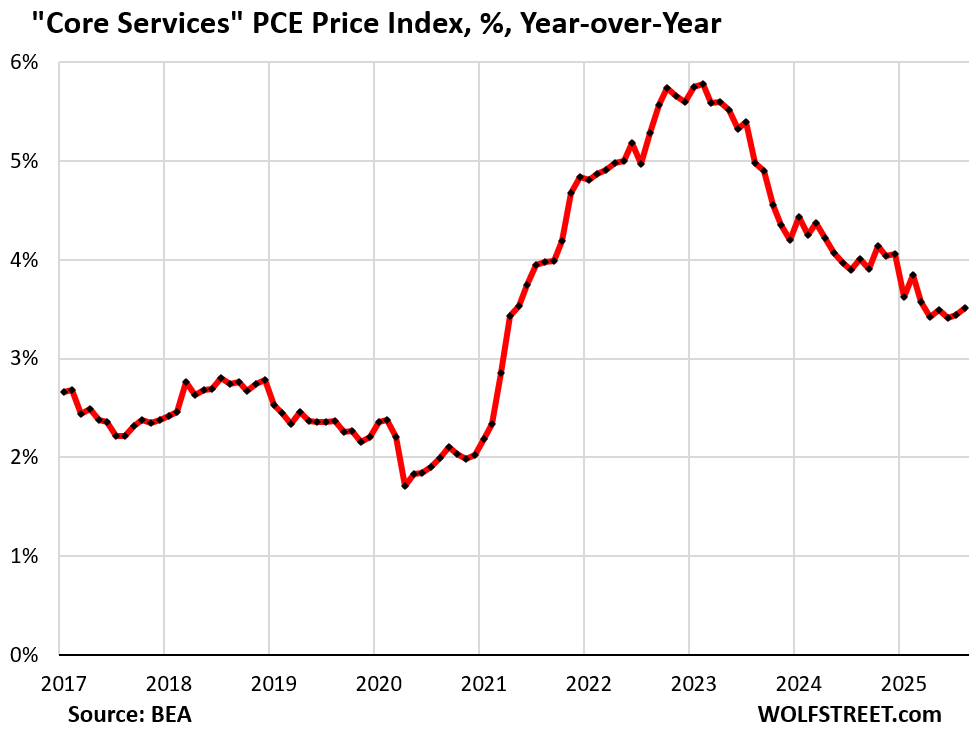
Year-over-year, the core services PCE price index accelerated to 3.51%, the second month in a row of acceleration. It is substantially above the pre-pandemic range and accelerating away from it.
Two-thirds of consumer spending is for services, and this year-over-year inflation rate of 3.5% powers the overall PCE price index and the core PCE price index.
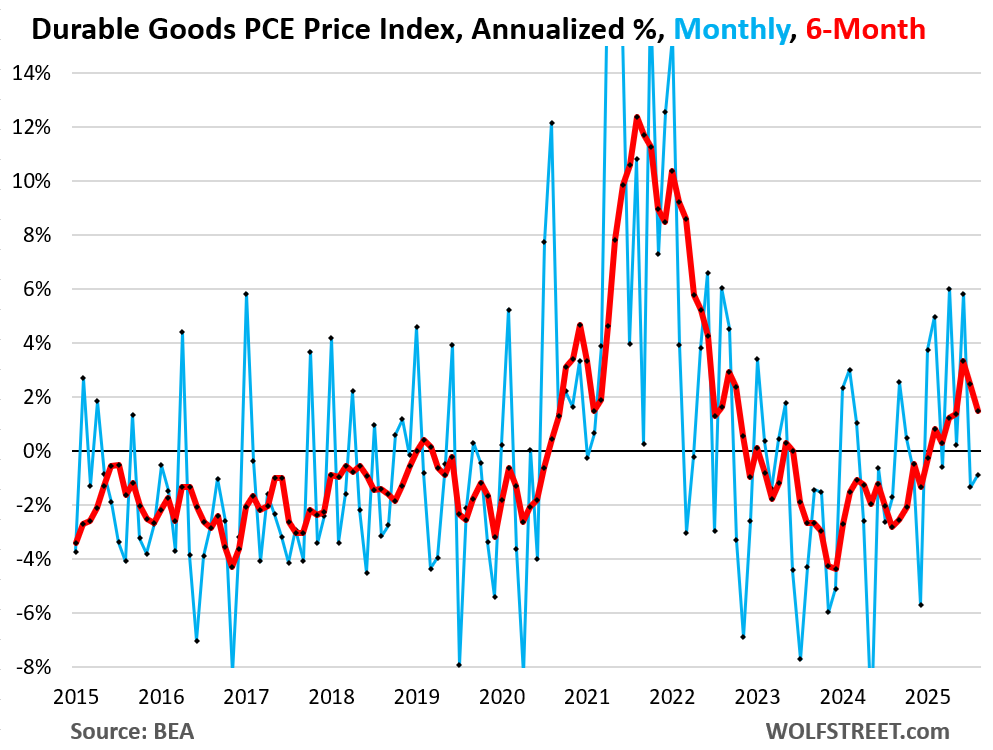
But the durable goods PCE price index fell by 0.1% (-0.8% annualized) in August from July, the second month in a row of negative readings.
Many durable goods are imported, or their components are imported, and many of them are tariffed. Durable goods include all motor vehicles, appliances, furniture, bicycles, laptops, phones, audio and video equipment, etc.
Durable goods are where a big part of the tariffs would show up. But whether or not companies can pass on these taxes depends on market conditions – whether consumers keep buying products at higher prices now that the free money is gone, or whether sales fall, and companies have to cut prices to get the sales they want.
Durable goods prices blew out from mid-2020 through mid-2022 and reached ridiculous levels, with year-over-year increases of over 10%, triggering a huge spike in corporate profits – which is where a big part of this inflation went.
But then consumers emerged from their pay-whatever stupor and began resisting higher prices by not buying these products when prices were raised further, causing sales to drop for these products, which forced companies to cut prices and offer deals in order to sell their goods.
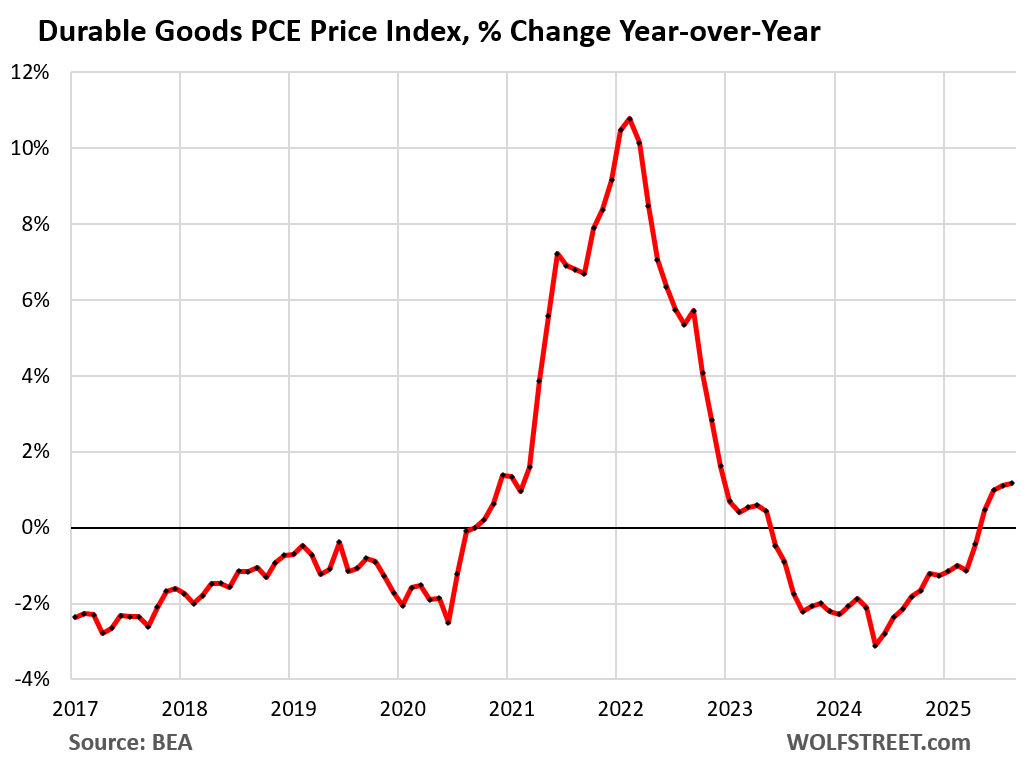
This price cutting from ridiculously high price levels was why the month-to-month durable goods PCE price index turned negative in late 2022, and why the year-over-year durable goods index turned negative in June 2023, reached -3.1% in early 2024, and then began to get less negative every month until April 2025 when it turned positive again.
In August, the year-over-year increase in the durable goods PCE index was 1.2%, which helped pull down overall inflation rates driven higher by services. And much of that has been due to used cars, whose prices have been re-surging for 12 months, after a hard plunge (used cars are not imported).
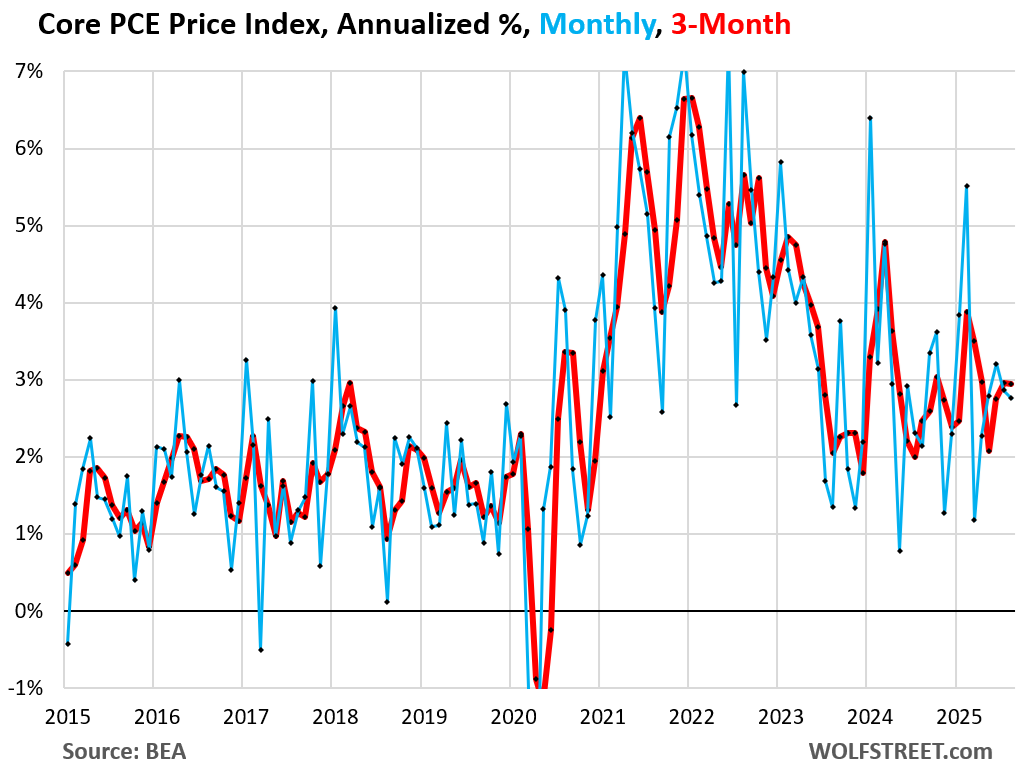
The core PCE price index decelerated to +0.23% (+2.8% annualized) in August from July.
The deceleration was the result of the negative readings in durable goods overpowering the acceleration in services.
The 3-month index rose by 2.9%, same increase as in July.
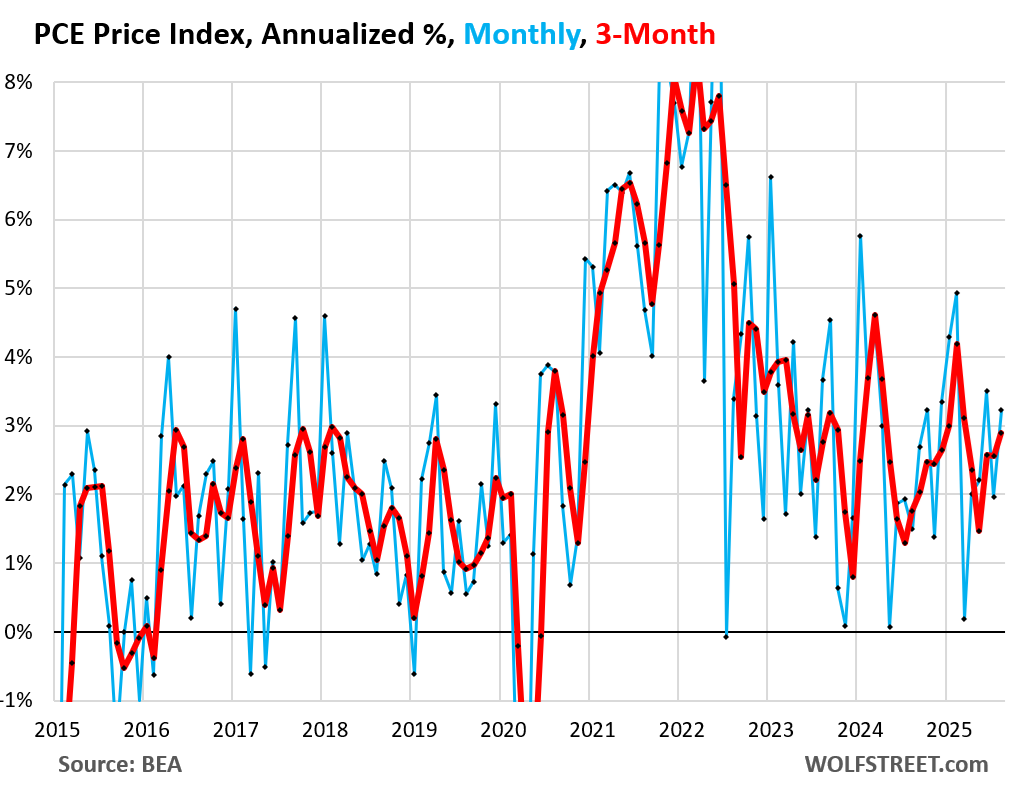
The headline PCE price index accelerated to +0.28% (+3.2% annualized) in August from July, pushed higher by month-to-month spikes in both:
- Food prices: +0.47% (+5.8% annualized)
- Energy prices: +0.79% (+9.9% annualized).
The 3-month headline index accelerated to 2.9% annualized.
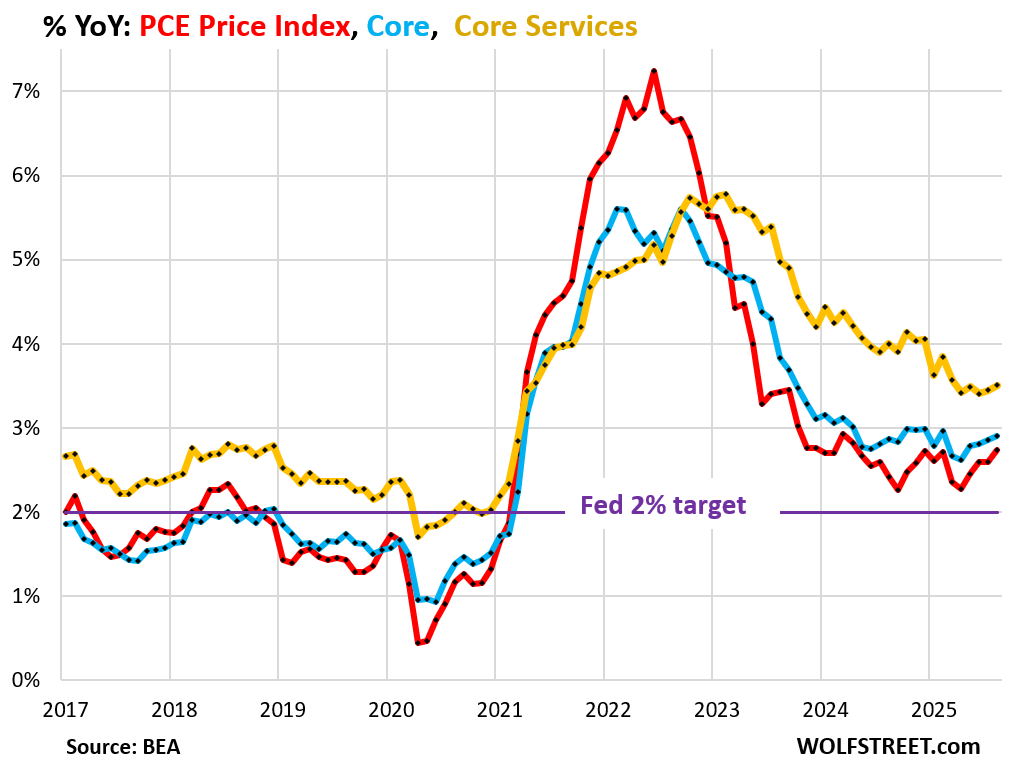
Year-over-year and the Fed’s 2% target.
The year-over-year overall PCE price index and the year-over-year core PCE price index form the yard stick that the Fed uses for its 2% inflation target. Both are well above the 2% target and accelerating away from it.
Both the overall PCE and core PCE were worse in August than they had been in August last year.
Overall PCE price index accelerated to 2.74% in August, worse than a year ago (2.41%), and the fourth month of acceleration in a row (red in the chart below).
Core PCE price index accelerated to 2.91%, worse than a year ago (2.87%), and the fourth month of acceleration in a row (blue in the chart).
Core services PCE index accelerated to 3.51%, the second month in a row of acceleration (yellow).
Enjoy reading WOLF STREET and want to support it? You can donate. I appreciate it immensely. Click on the mug to find out how:

![]()
WOLF STREET FEATURE: Daily Market Insights by Chris Vermeulen, Chief Investment Officer, TheTechnicalTraders.com.
Source link

