Food prices also spiked. Energy prices surged due to diesel, jet fuel, and industrial electric power. Ugly all around.
By Wolf Richter for WOLF STREET.
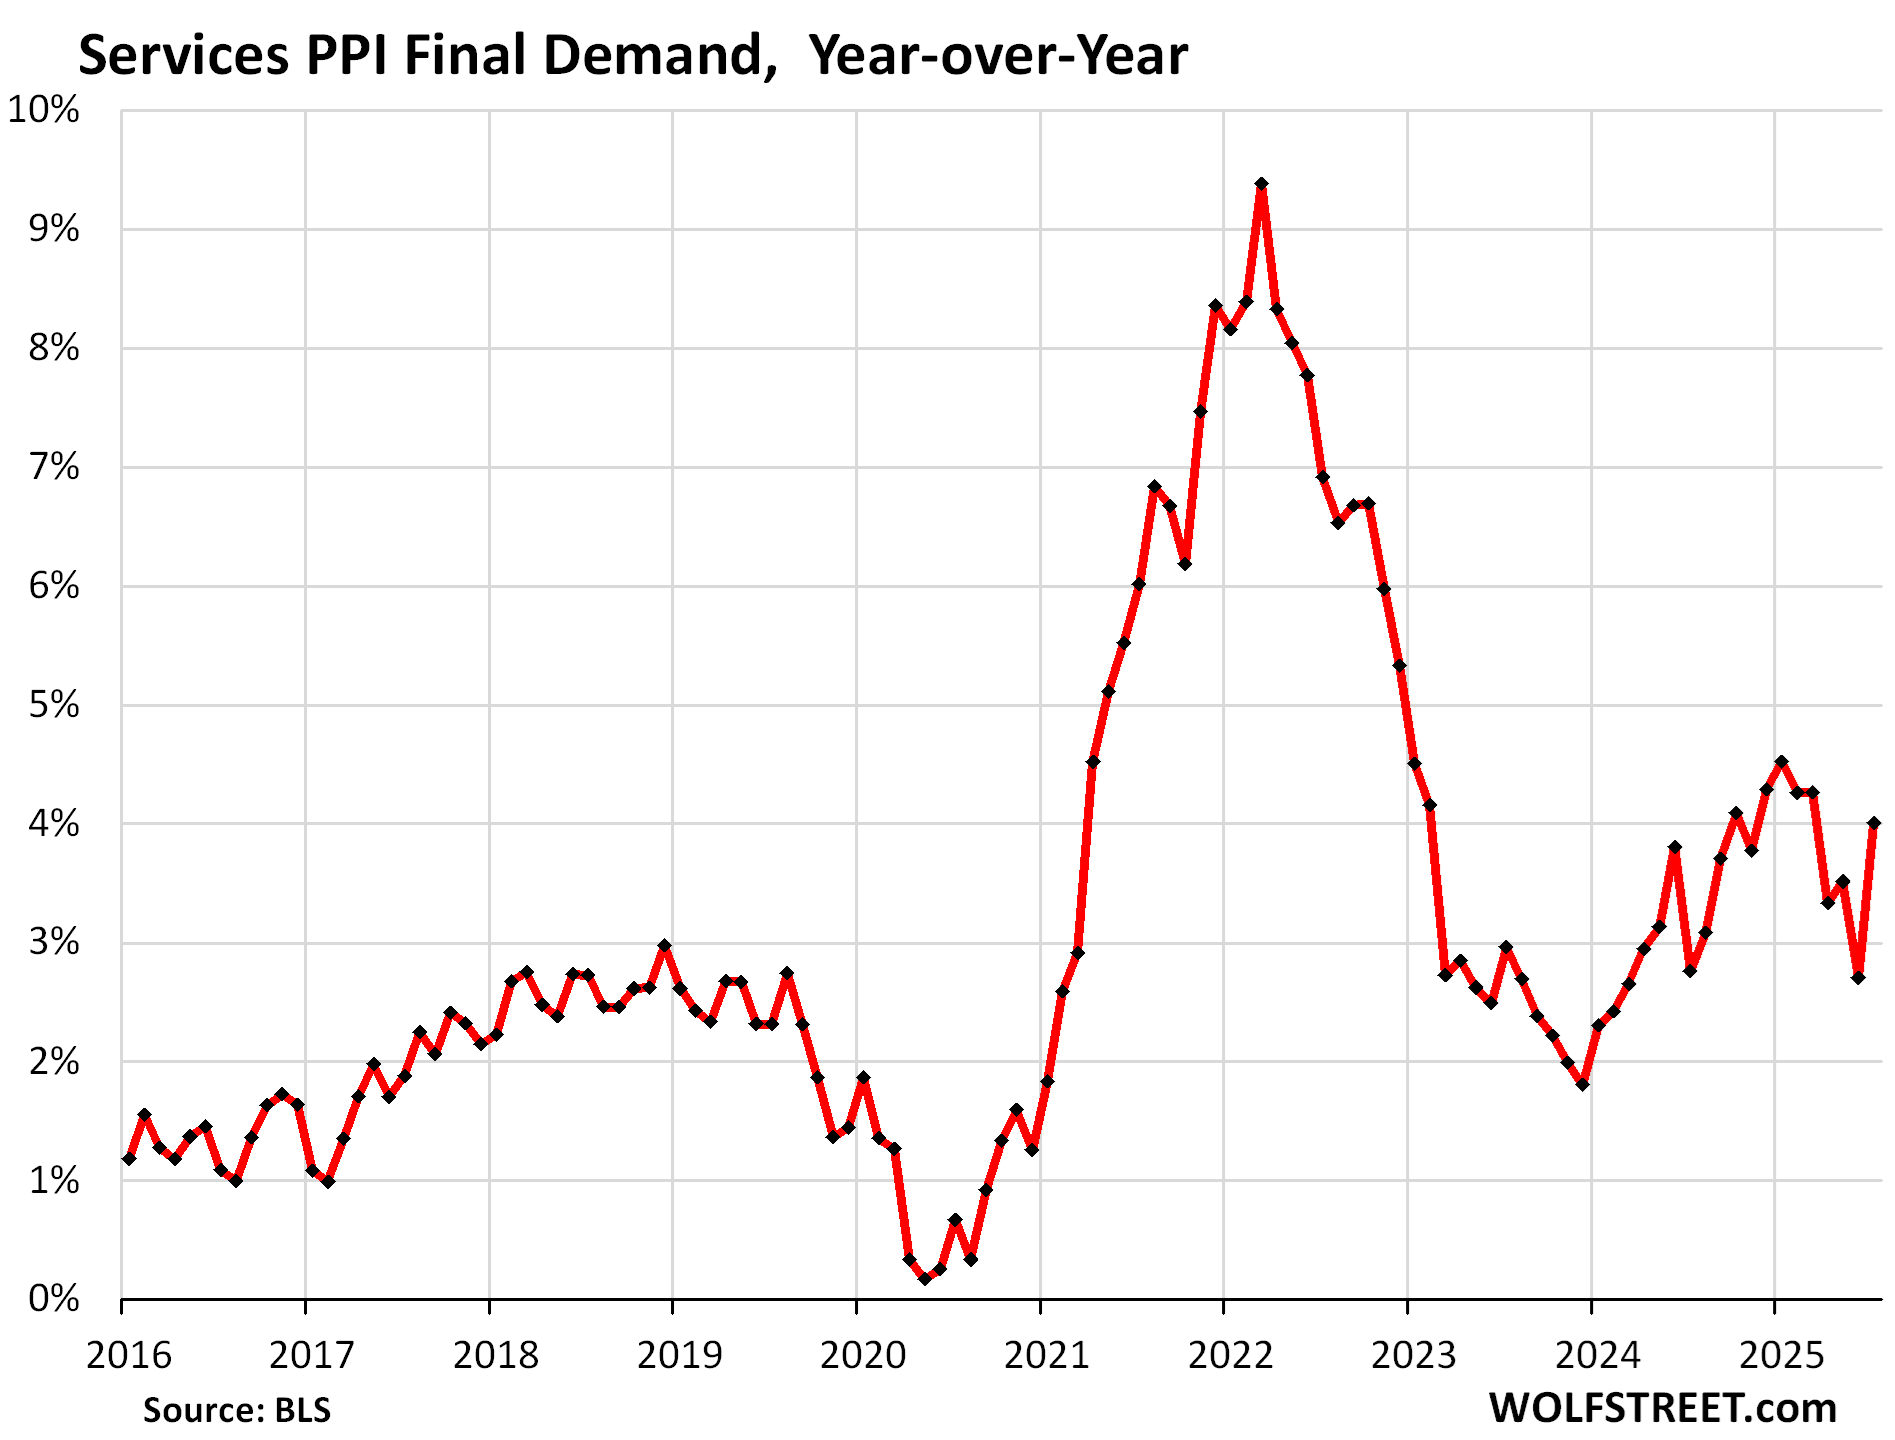
In another inflation shocker – services again! – the Producer Price Index Final Demand for Services exploded by 1.08% in July from June (+13.8% annualized!), the worst since March 2022 when inflation was peaking (blue in the chart). It was broad based: Prices for services less trade, transportation, and warehousing spiked by 0.69% (8.6% annualized), while prices for transportation and warehousing services spiked by 1.01% (12.8% annualized).
This explosion in services prices caused the “core” PPI Final Demand, which excludes food and energy, to spike by 0.92% month-to-month (+11.6% annualized), the worst since March 2022. And it caused the overall PPI Final Demand to spike by 0.94% (+11.9% annualized), the worst since March 2022, with food prices and energy prices also surging.
The six-month average of core Services PPI, which irons out some of the huge month-to-month zigzags, but also then lags sudden U-turns, accelerated to +2.8% annualized (red in the chart).

Year-over-year, the core services PPI jumped by 4.0%, a steep acceleration.
Where the new tariffs fit in.
The PPI does not track import prices, and therefore doesn’t directly track the costs of tariffs that companies are paying on imported goods. It tracks prices that companies charge each other, including export prices, and so indirectly, it tracks how companies eat the tariffs or pass them to other companies.
Companies have been paying the tariffs – $28 billion of them in July alone. In their earnings warnings and quarterly reports, consumer-goods companies, such as automakers across the board and companies such as Nike, have already disclosed how much those tariffs are costing them as they have trouble passing them on to consumers because additional price increases would cause sales to fall.
For them, the problem is that they’d already jacked up prices into the sky in 2020 through mid-2022, leading to an extraordinary historic profit explosion. And now they’ve hit consumer resistance.
The tariffs are percolating through the prices that companies charge each other, but have shown up only in small increments in consumer prices, totally overpowered by the renewed surge of inflation in services, which are not tariffed, which often have little price competition, and where consumers do most of their spending. It’s services inflation at the consumer level that is so hard for the Fed to contain, which is why the Fed fears services inflation so much.
Core goods: plenty of inflation, but not nearly as bad as services.
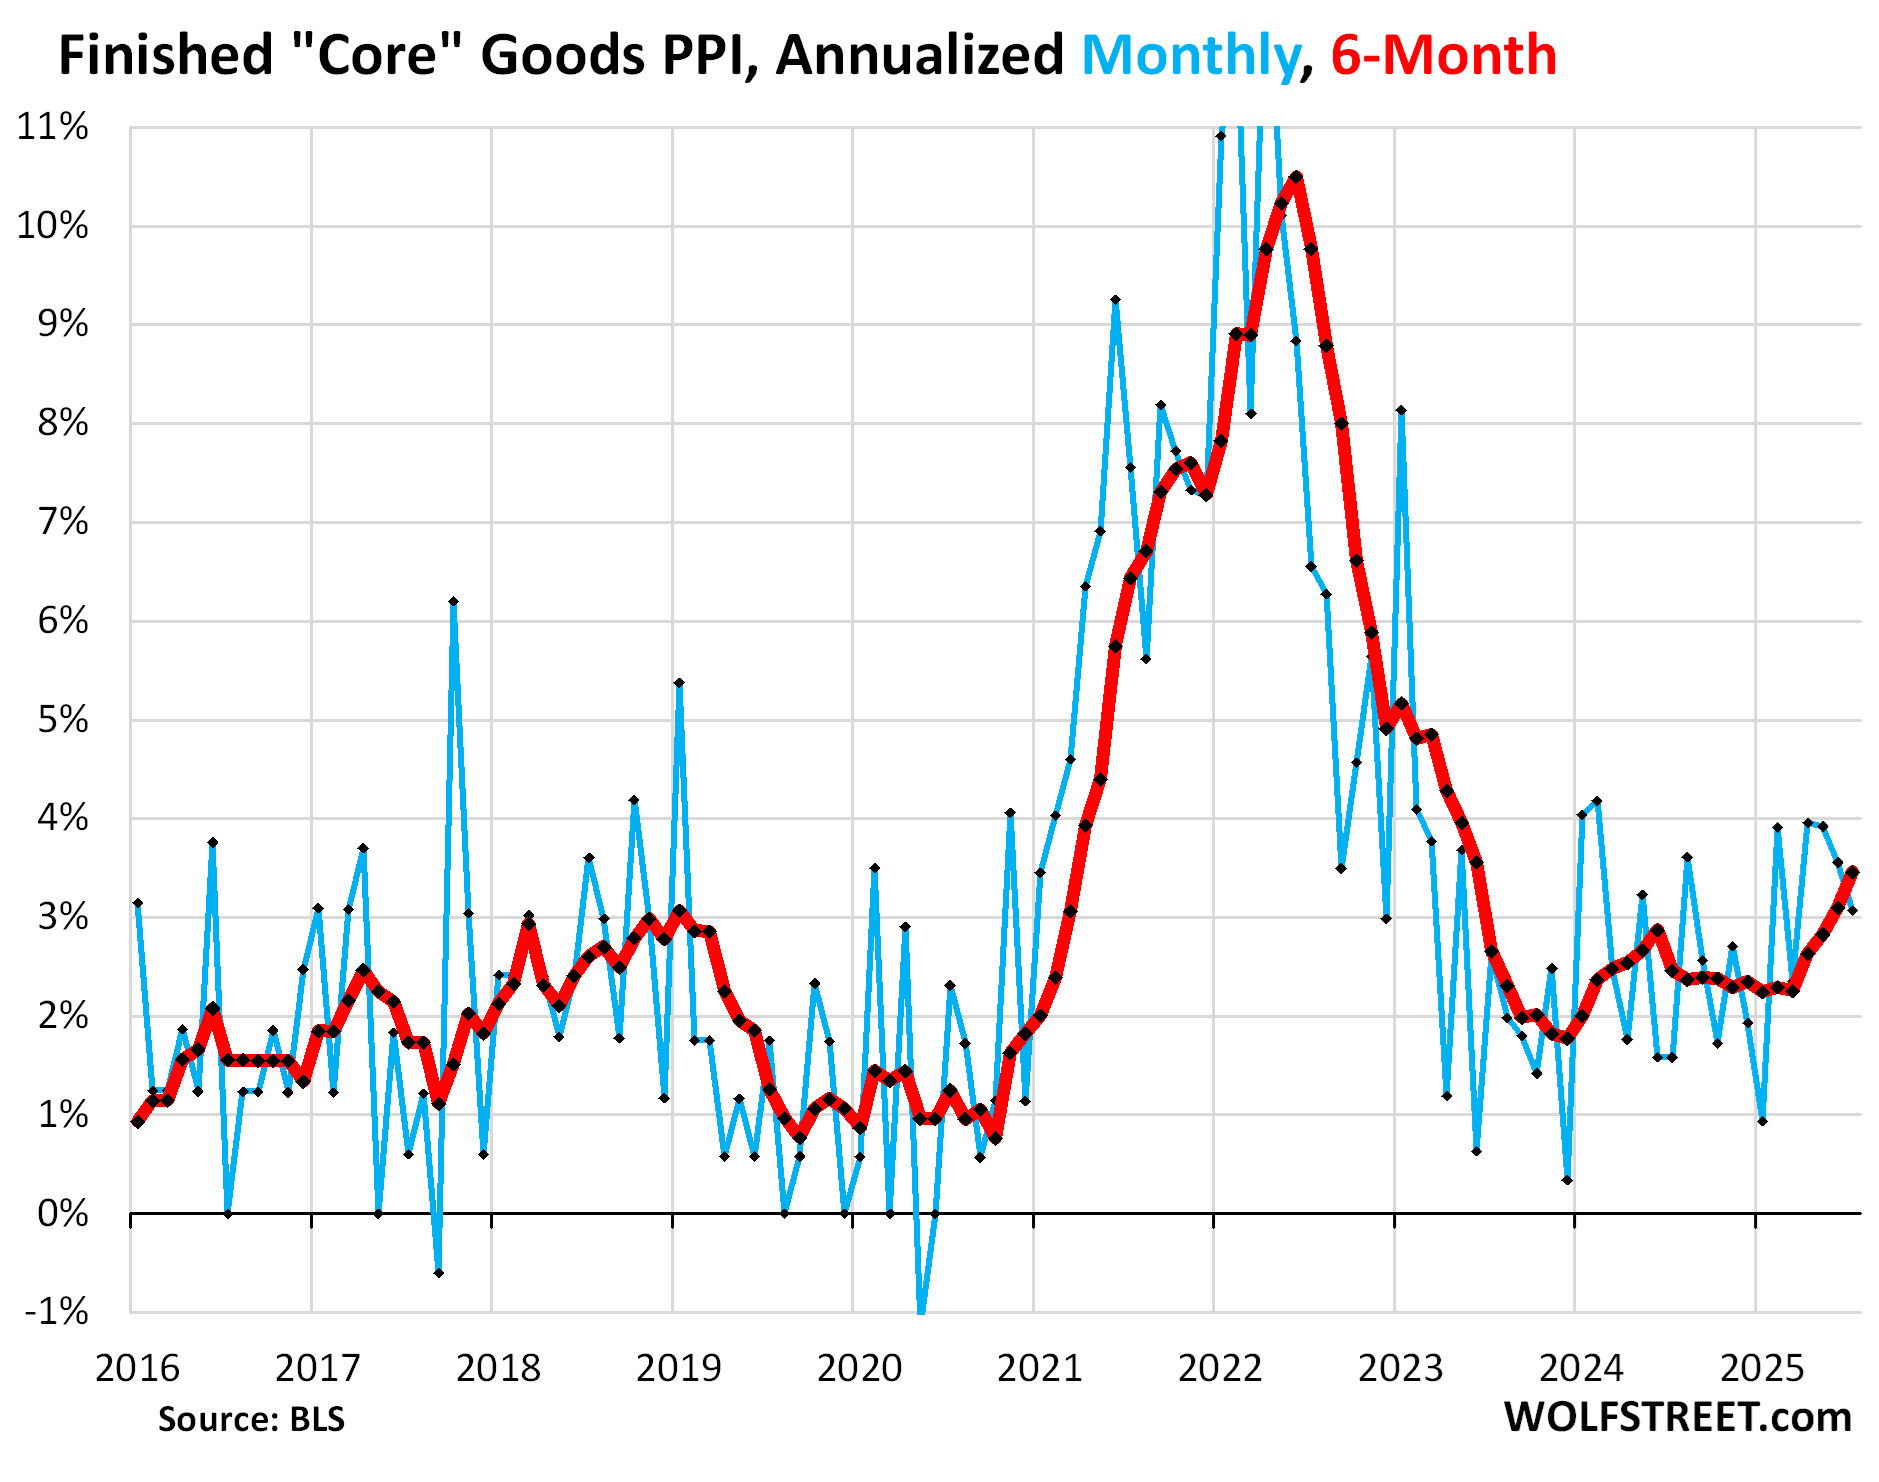
The PPI for “Finished Core Goods” cooled a little, rising by 3.1% annualized, a deceleration from increases in the 3.6% to 4.0% range in the prior three months. This measure excludes food and energy.
The six-month average continued to accelerate and reached 3.5% annualized in July, the worst since June 2023.
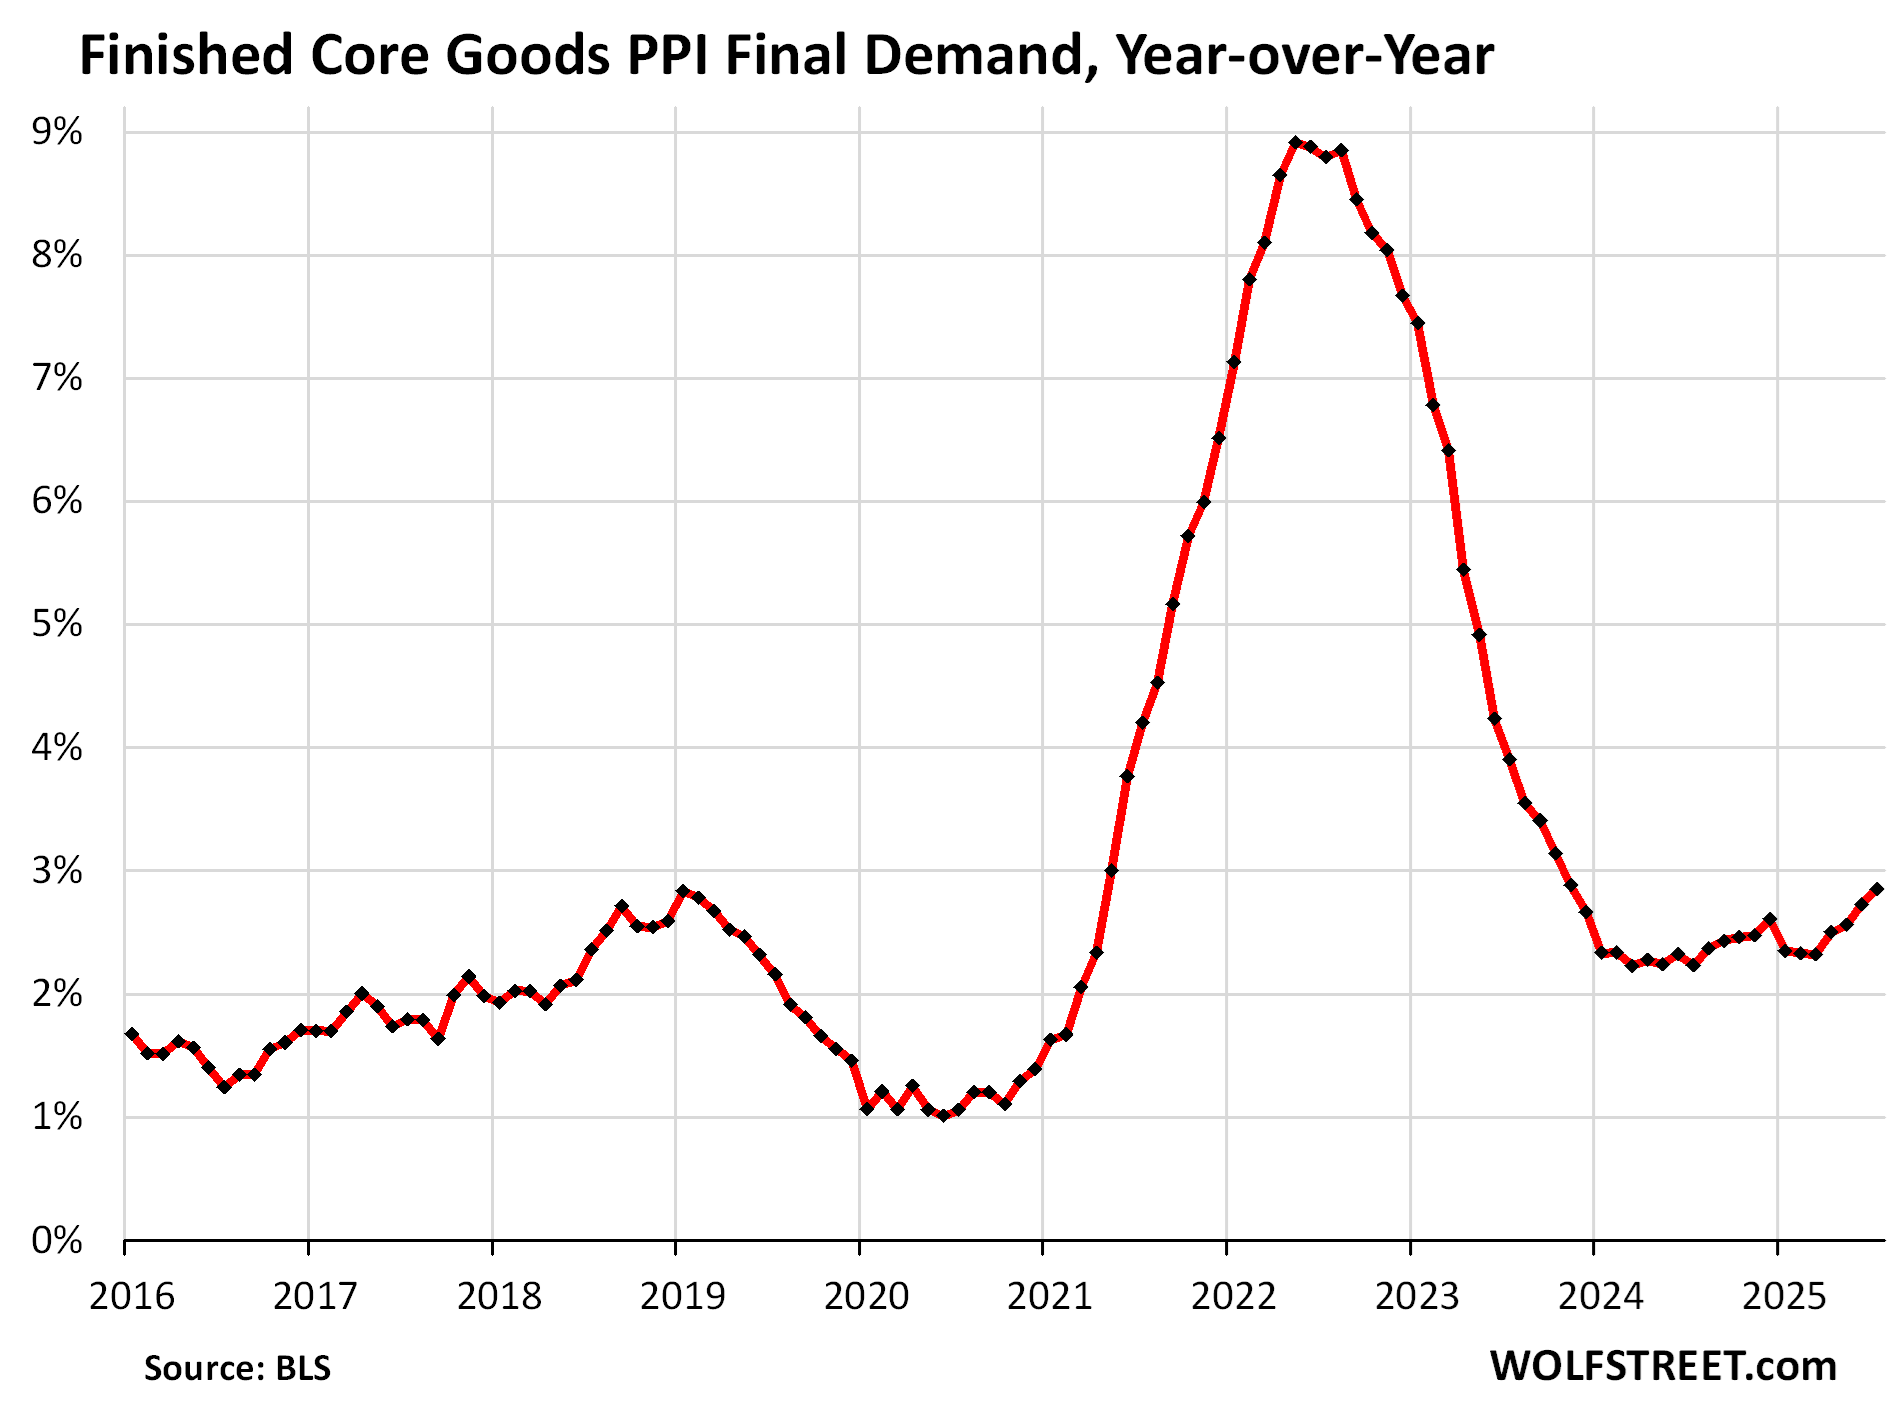
Year-over-year, the PPI for finished core goods accelerated slightly to 2.85%, the worst since June 2023.
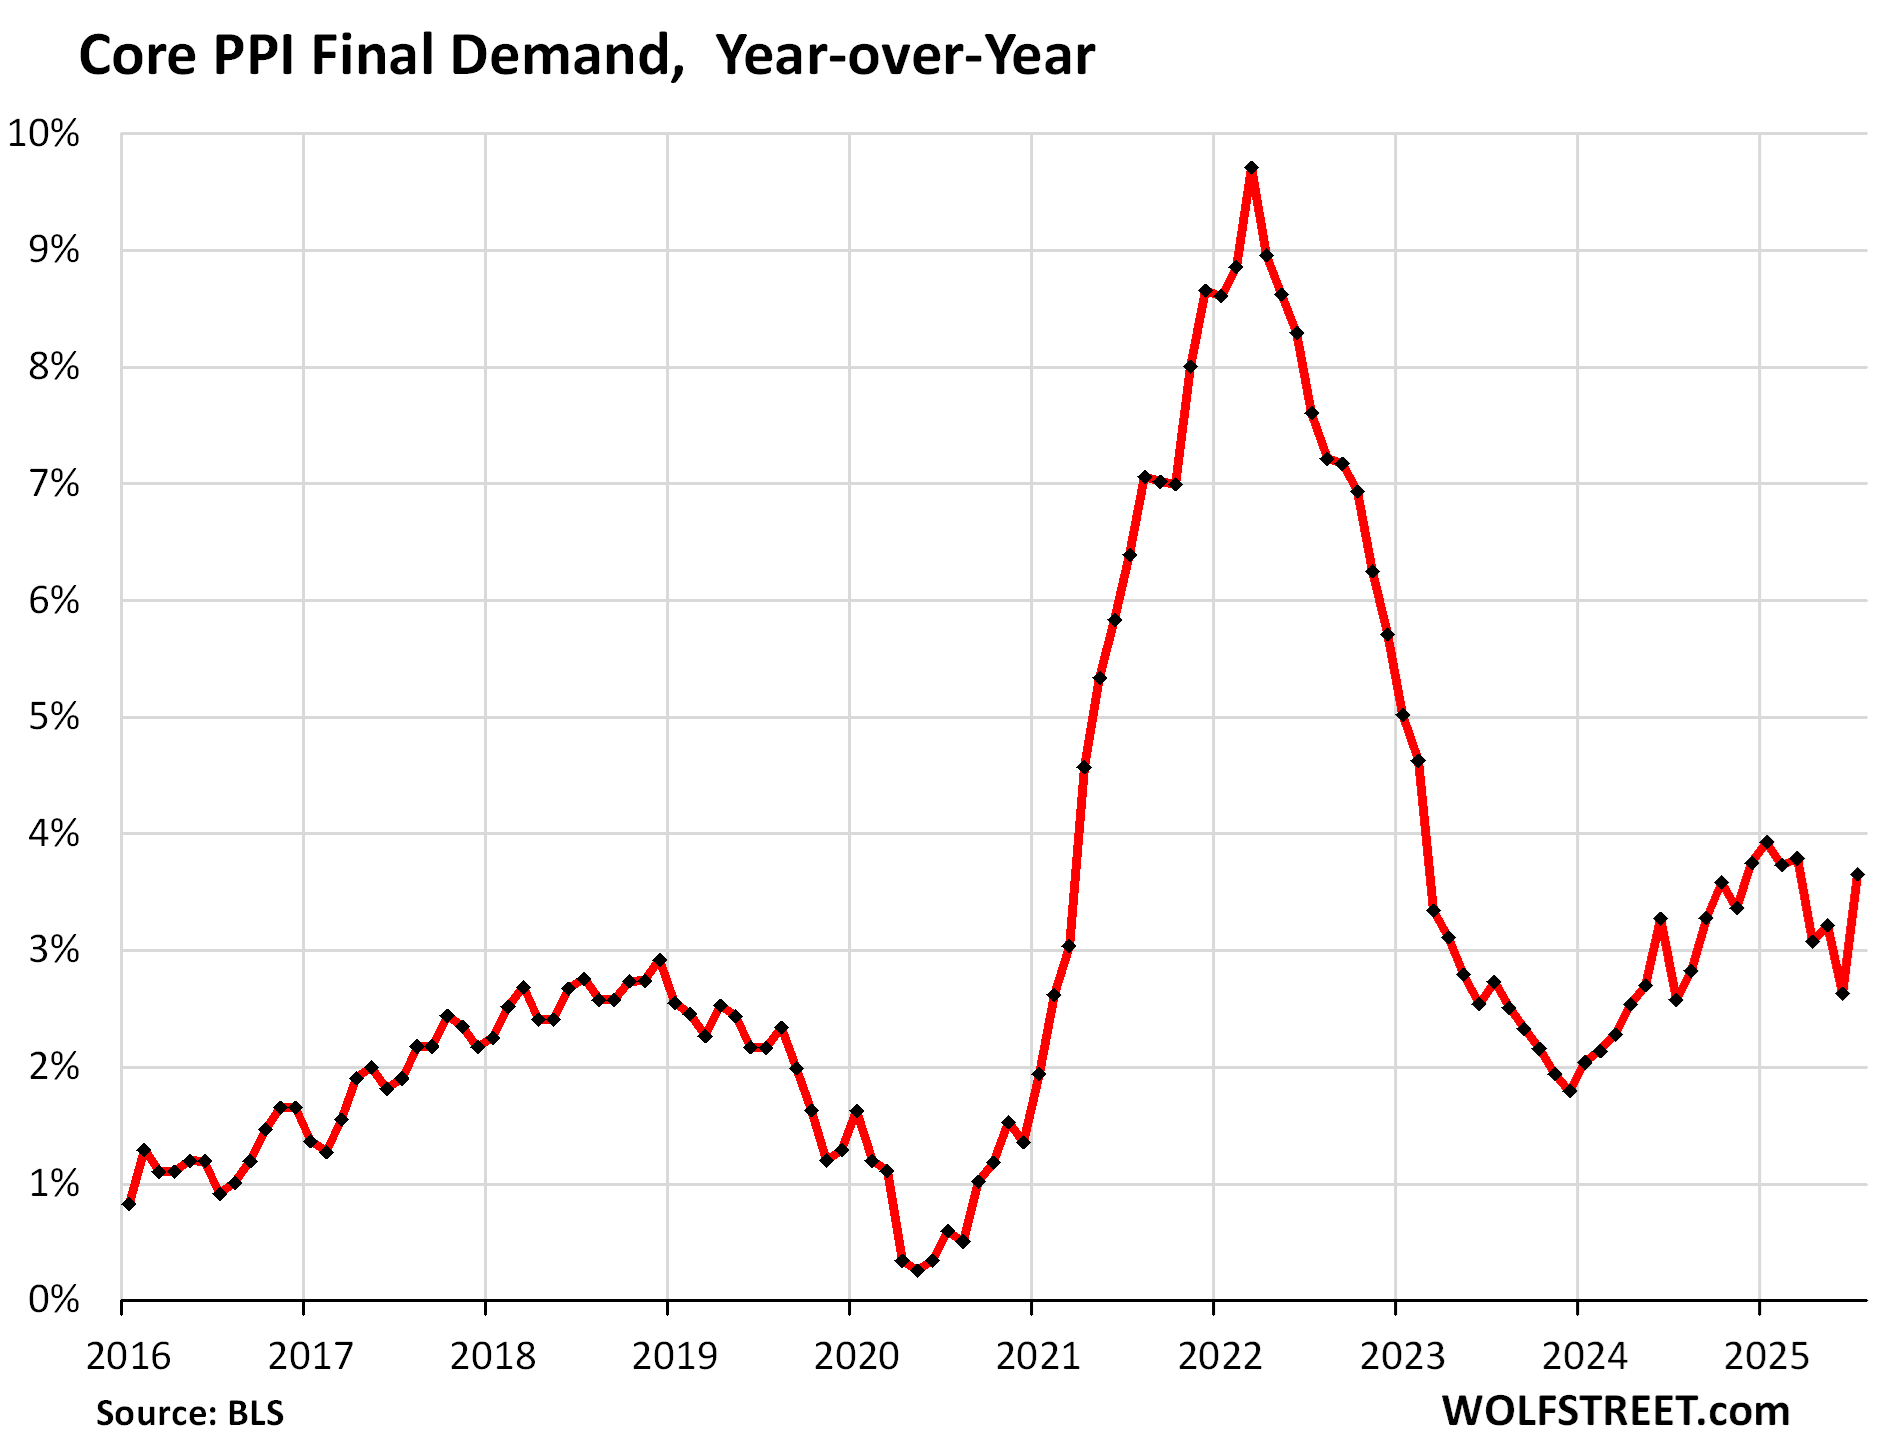
“Core PPI Final Demand, which includes all goods and services except food and energy, exploded by 0.92% in July from June (+11.6% annualized), the worst spike since March 2023, driven by the price explosion of the services PPI. The six-month average accelerated to 2.9%.
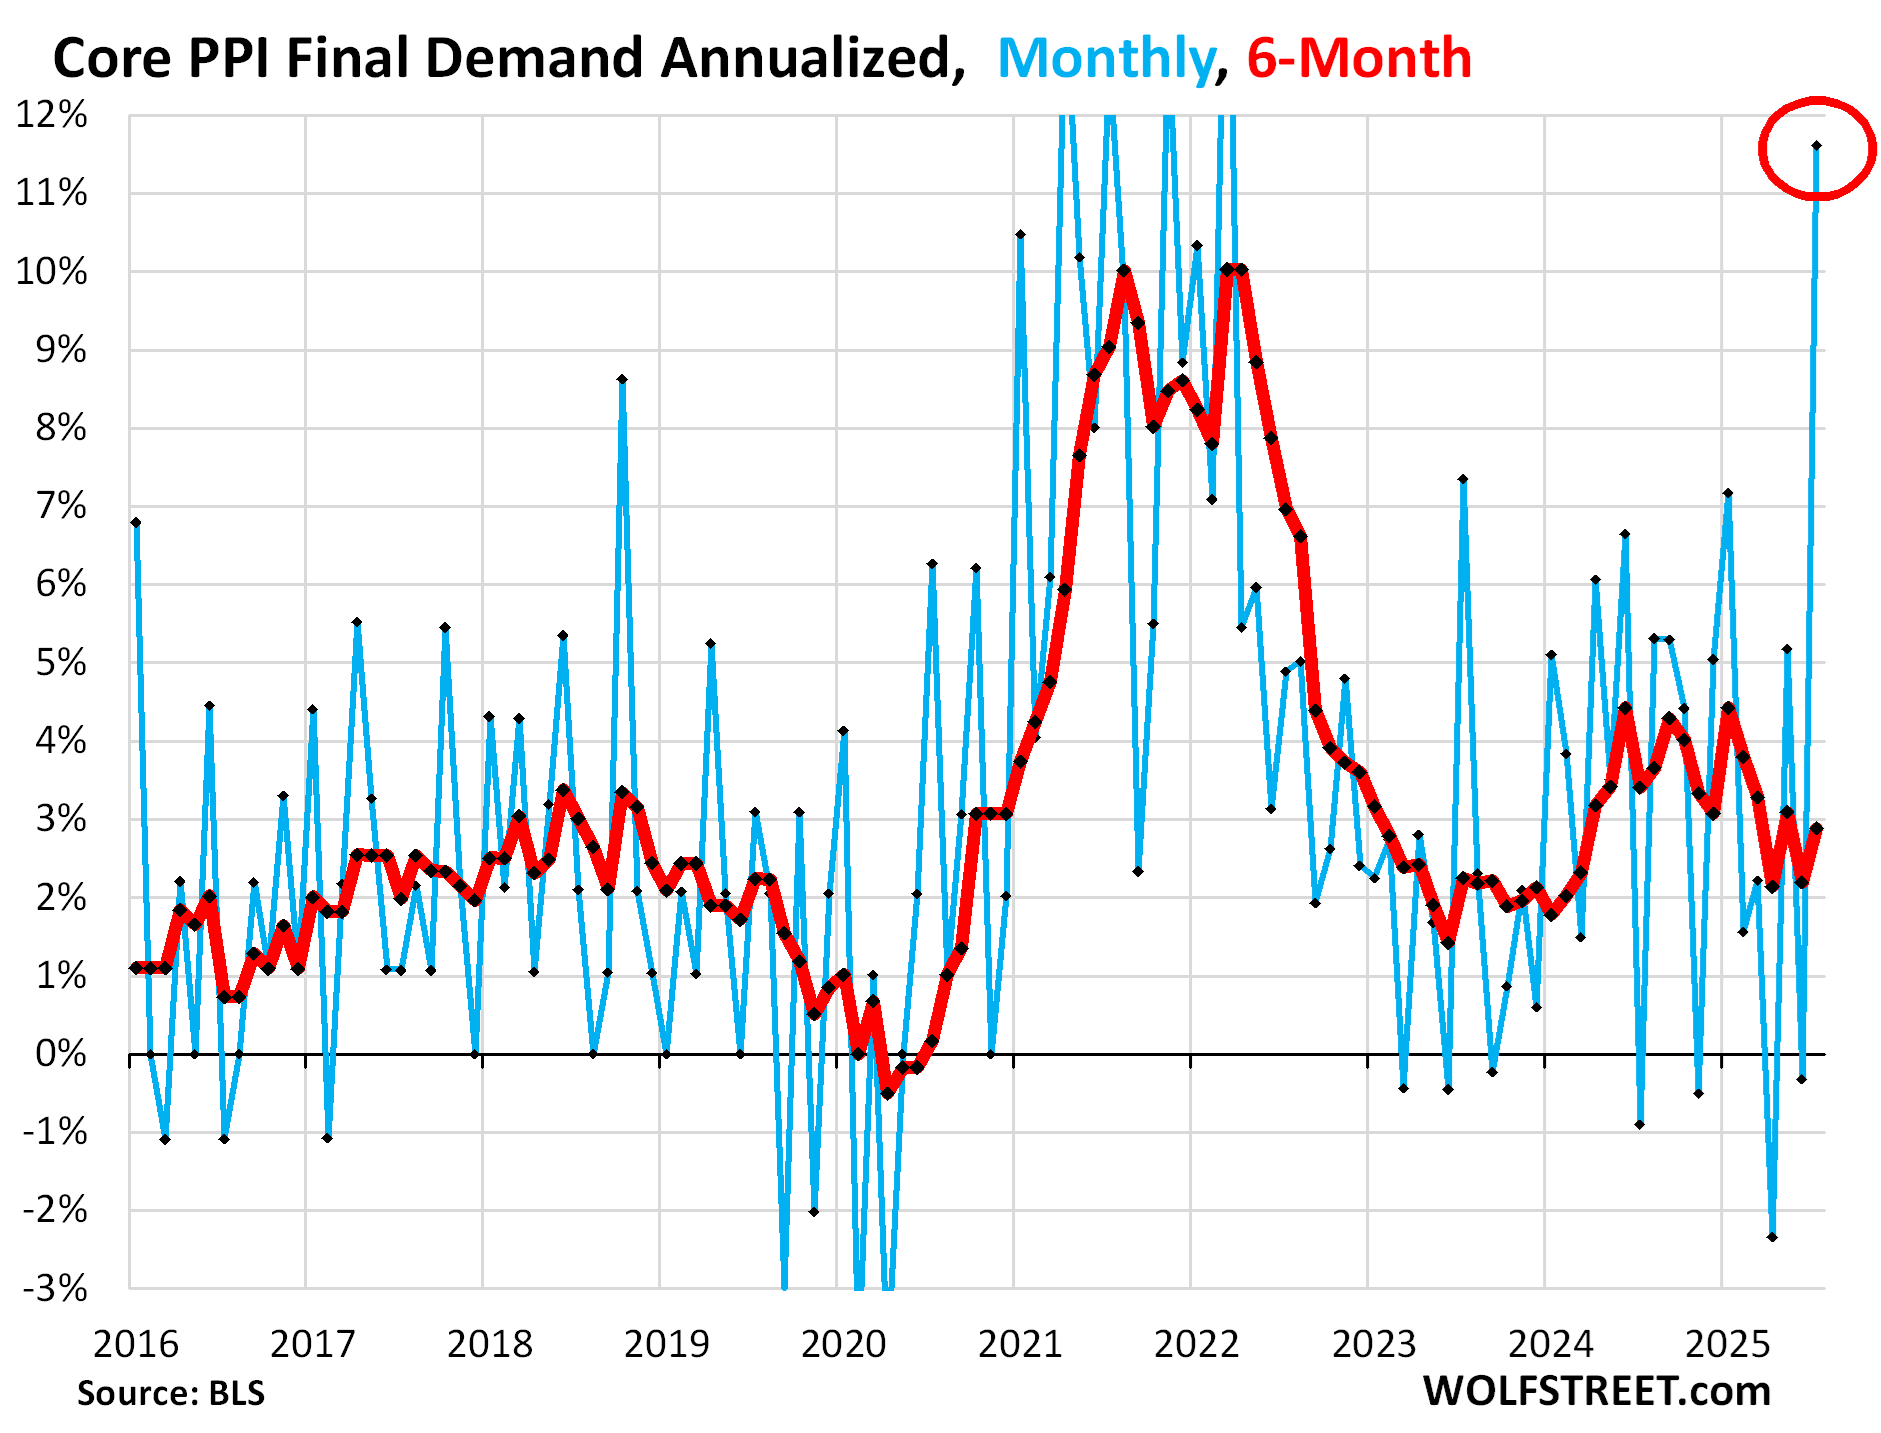
On a year-over-year basis, the core PPI accelerated sharply to +3.7%:
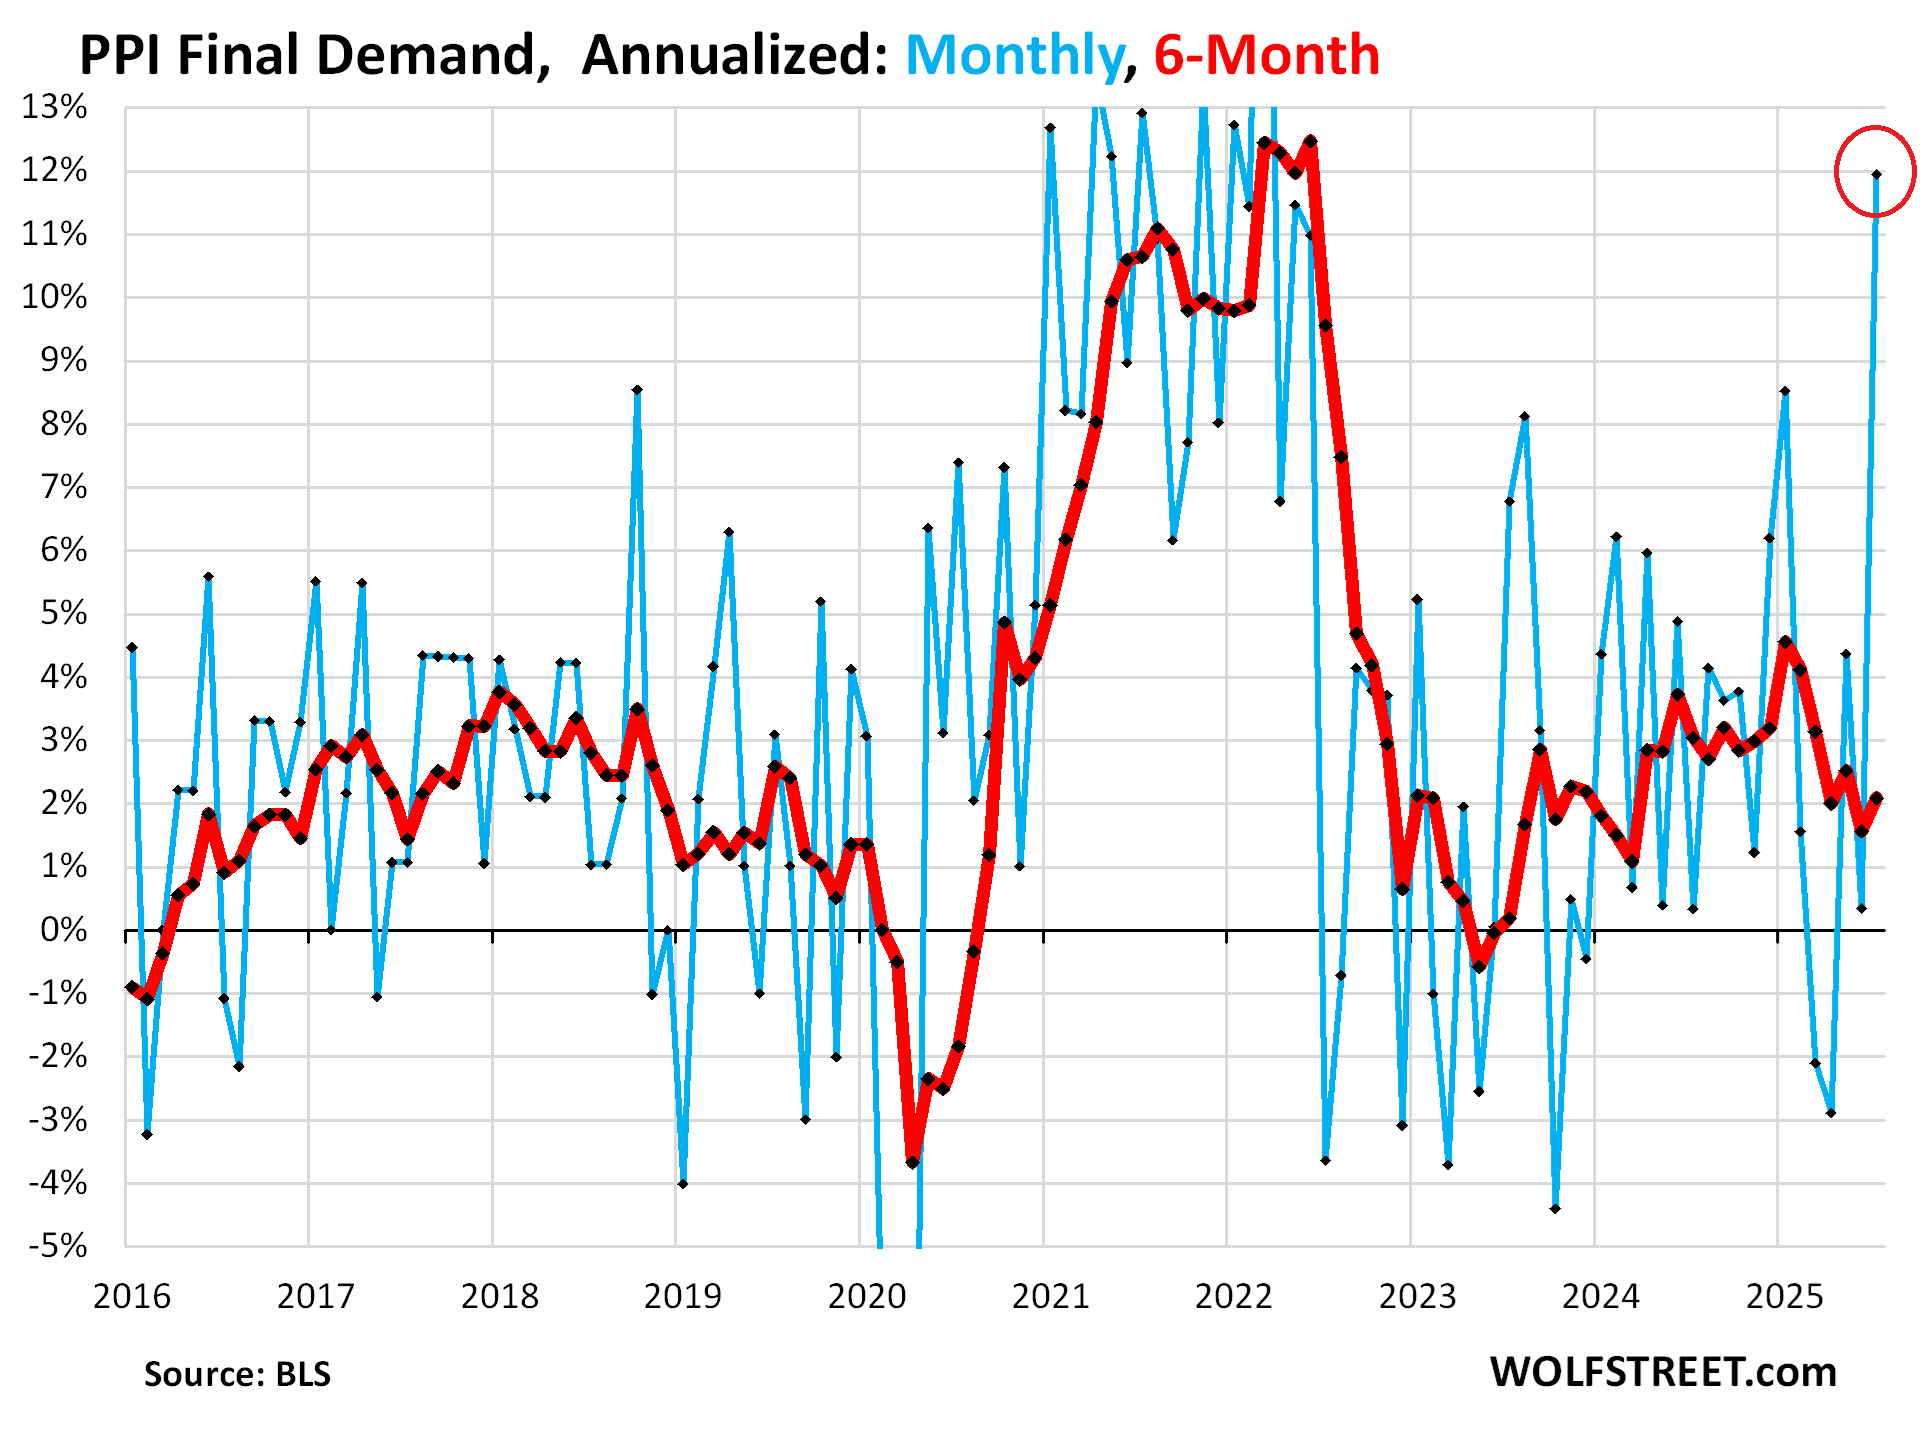
Overall PPI Final Demand exploded by 0.94% (+11.9% annualized), the worst spike since March 2022, fueled by the explosion of the core services PPI.
And it was further fueled by the surge in food prices (+1.4% month-over-month).
Energy prices also surged (+0.9% month-over-month) on higher prices for diesel, jet fuel, and industrial electric power, though gasoline prices declined.
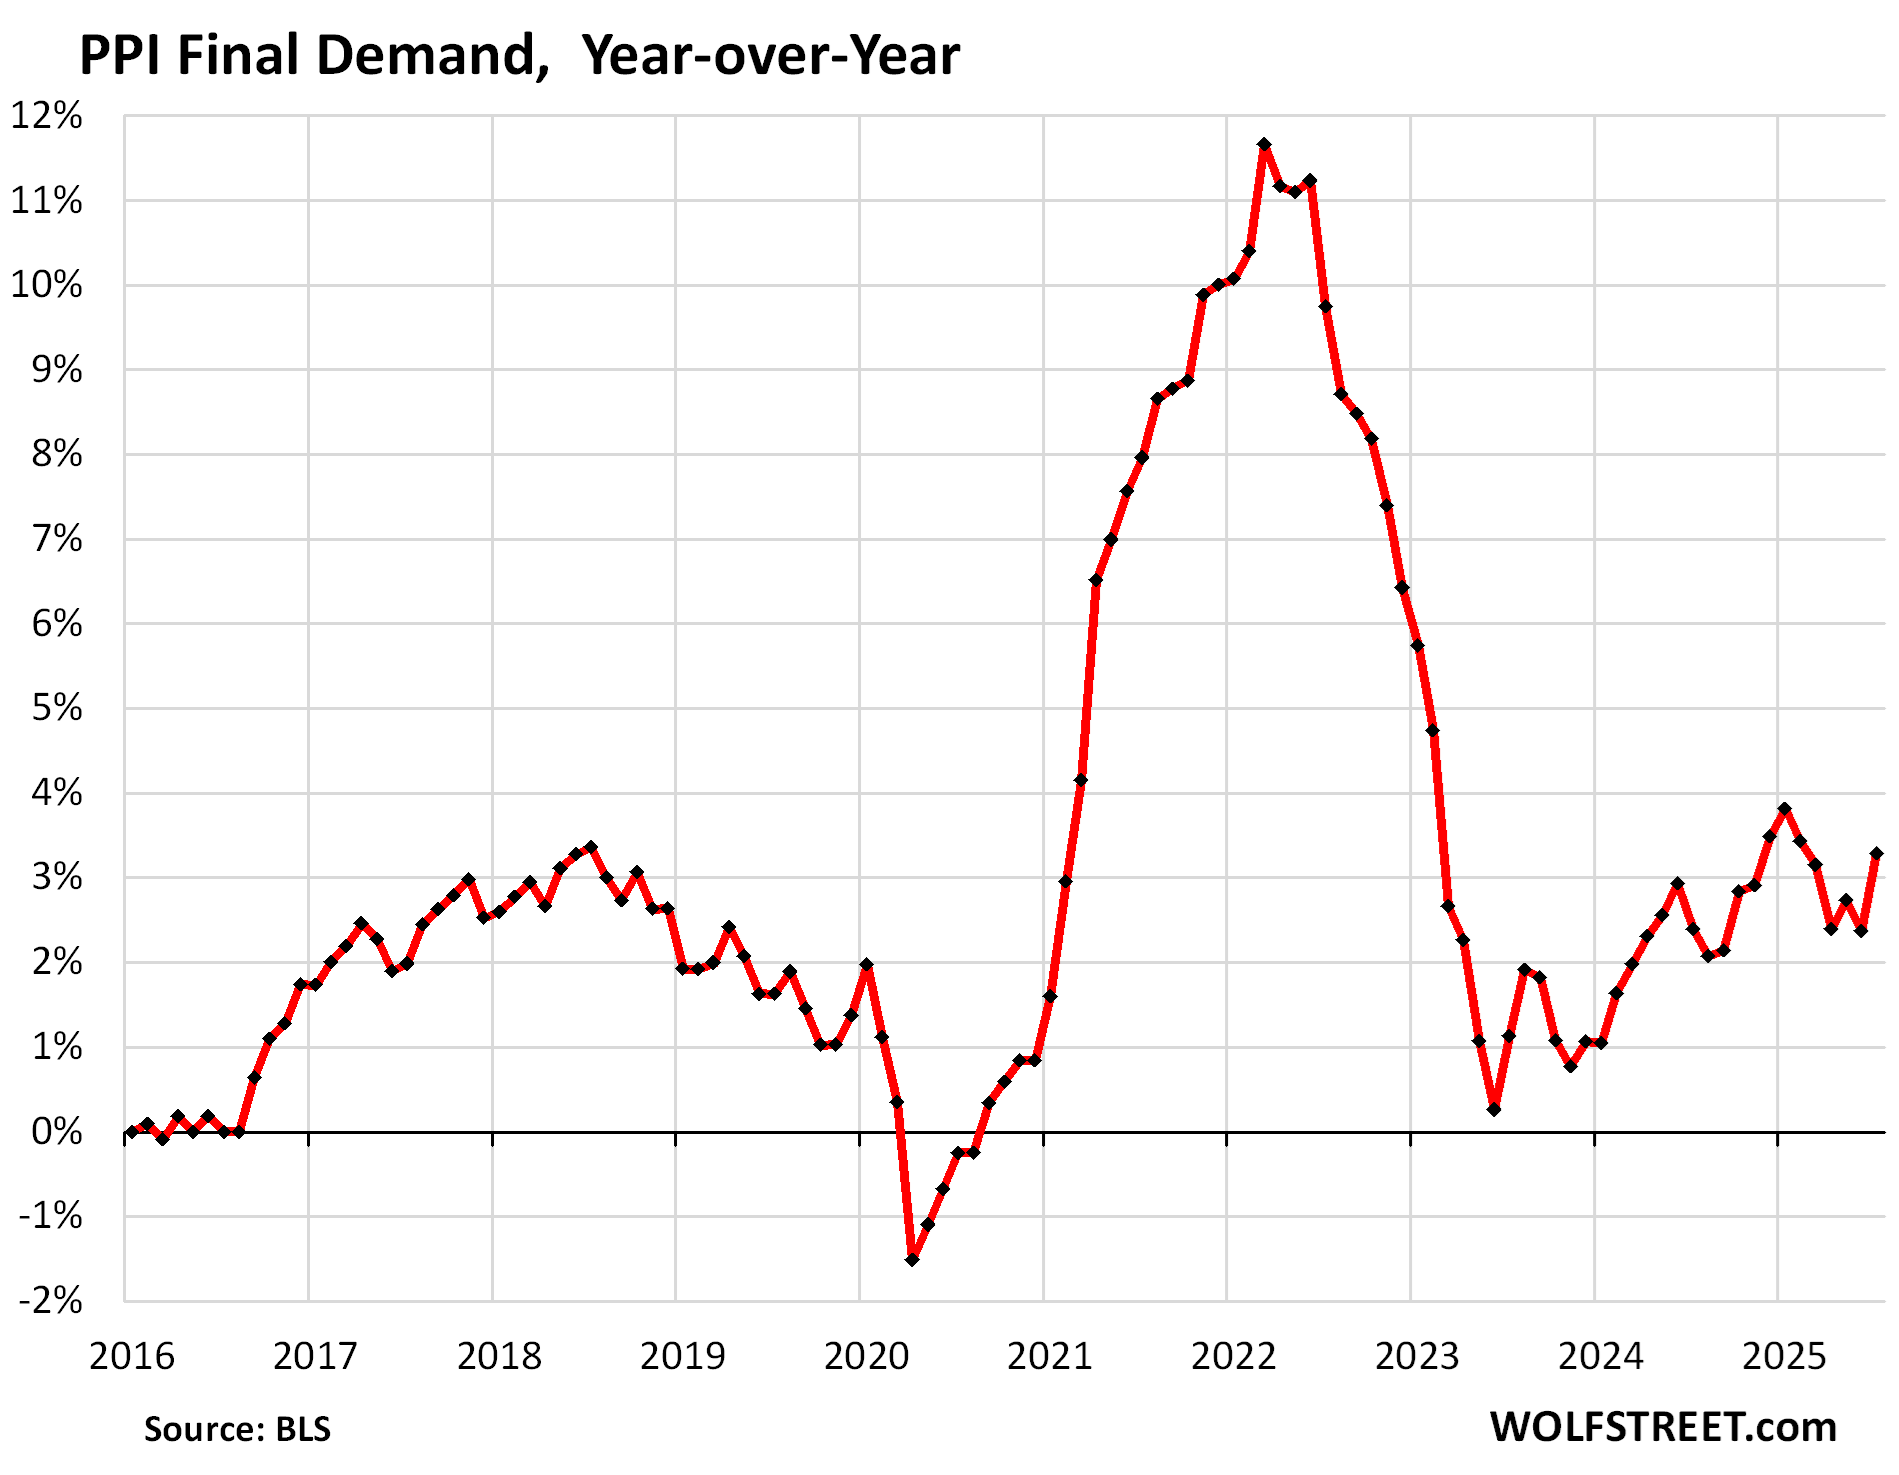
On a year-over-year basis, the PPI Final Demand accelerated to 3.3%, the worst since February.
Note how the acceleration in its uneven manner started in the second half of 2023, with June 2023 having marked the low point at near 0%.
What I expect.
Just by looking at the month-to-month blue lines in these charts, how much they zigzag, I expect further zigzags, big ones too. After a huge spike, we’ve often seen a much smaller increase or even a negative reading, and vice versa.
It’s the sum of those zigs and zags over time that mark inflation at the producer level. So I expect a sharp reversal of the services zig in a month or two. But I also expect the sum of those zigs and zags in the services PPI to trend higher on a six-month basis and on a 12-month basis and drag core PPI and overall PPI with it.
As mentioned, PPI reflects what companies charge other companies – not consumers. Companies paid $28 billion in tariffs in July, and they paid $27 billion in June, and $22 billion in May. Tariffs are a tax, but tax increases are hard to pass on, and tax cuts are never passed on.
But we can see the tariffs percolating through the ecosystem of companies as they’re trying to pass on some of the tariffs to other companies, and these other companies are resisting those price increases.
The far bigger concern here is inflation in services, which are not tariffed, which are a much bigger part of US economic activity, and where roughly two-thirds of consumer spending goes to.
And services inflation at the consumer level, such as tracked by CPI, has been reheating: Two days ago, the core services CPI shot up by 4.5% annualized, the worst in six months. It accounts for 60% of overall CPI. The push came from services other than housing. And today’s explosion of the services PPI is not encouraging, even if the next zag is much smaller.
And one more thing: The PCE price index, a measure of consumer price inflation that the Fed uses for its 2% target, includes some parts of the core services PPI here, such as the category of “portfolio management; securities brokerage, dealing, investment advice, and related services,” which also surged. The July PCE price index will be released on August 29, and it might come in hot due to services inflation, further fueled by the components from the services PPI here.
Enjoy reading WOLF STREET and want to support it? You can donate. I appreciate it immensely. Click on the mug to find out how:

![]()
WOLF STREET FEATURE: Daily Market Insights by Chris Vermeulen, Chief Investment Officer, TheTechnicalTraders.com.
Source link

