Fed’s Nightmare, but it’ll cut anyway: CPI, Core CPI, and Core Services CPI all over 4% annualized. Goods prices spiked for Used Vehicles, Food, Gasoline.
By Wolf Richter for WOLF STREET.
Core services, which dominate the inflation index and include many of the essentials that consumers cannot do without – housing, healthcare, insurance, etc. – rose by 4.3% annualized in August from July, the second month in a row over 4%. In goods, the biggie was the spike in used-vehicle prices, continuing a year-long trend. Food and gasoline prices jumped.
“Core” CPI, which excludes food and energy components to track underlying inflation, accelerated to +0.35% in August from July (+4.2% annualized), the worst since January, and beyond January, the worst since March 2024 (blue in the chart below).
Year-over-year, “core” CPI accelerated to +3.1% annualized, the worst since February, and the fourth acceleration in a row (red):

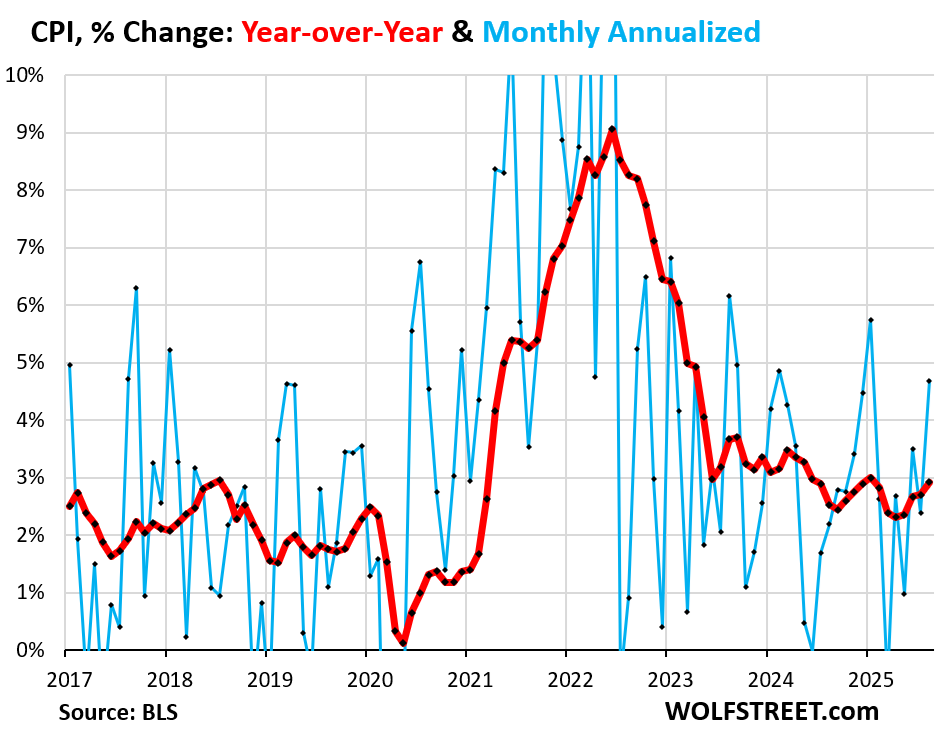
The overall CPI, which includes food and energy, rose by 0.38% (+4.7% annualized) in August from July, the worst since January, and beyond January the worst since February 2024 (blue in the chart below).
Food and energy prices both increased month to month in August, after declining in July.
Year-over-year, overall CPI rose by 2.9%, the worst increase since January, and the fifth acceleration in a row (red)
Core services move the needle.
They include housing costs, medical care, health insurance, auto insurance, tenant’s insurance, subscriptions; telephone, internet, and wireless services; lodging, rental cars, airline fares, education, movies, sports events, club memberships, water, sewer, trash collection, motor vehicle maintenance and repair, etc.
They account for two-thirds of the CPI basket, and that’s where inflation ran over 4% annualized for the second month in a row.
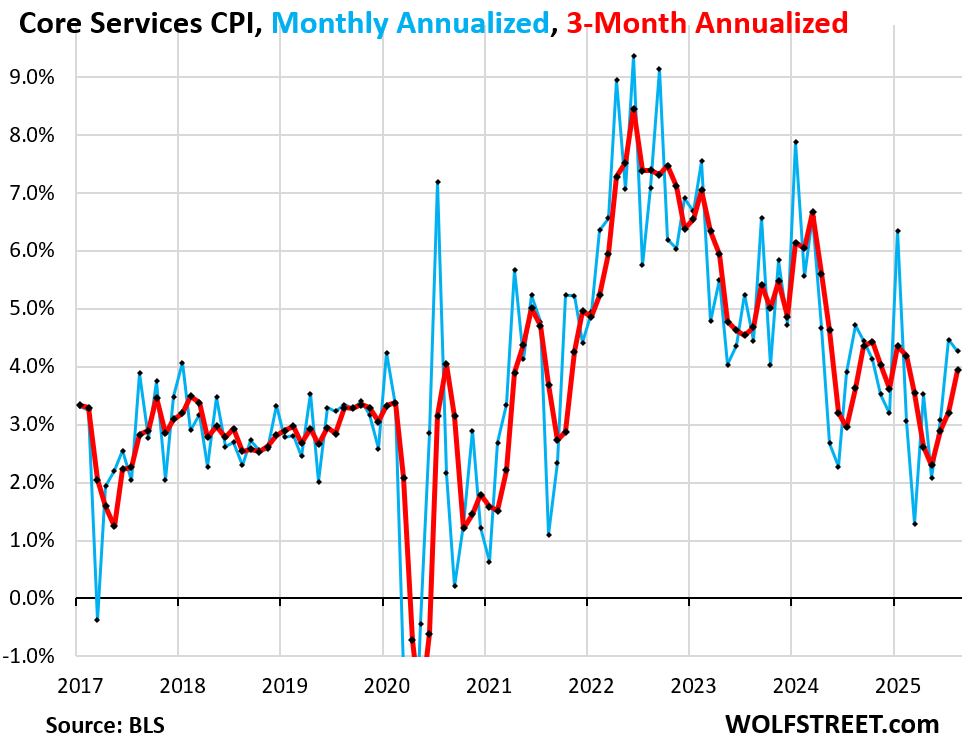
Core services CPI rose by 4.3% annualized in August from July (+0.35% not annualized), after having risen by 4.5% annualized in July, and both were the worst increases since January (blue in the chart).
The three-month core services CPI accelerated to 3.9% annualized, the third month in a row of acceleration (red).
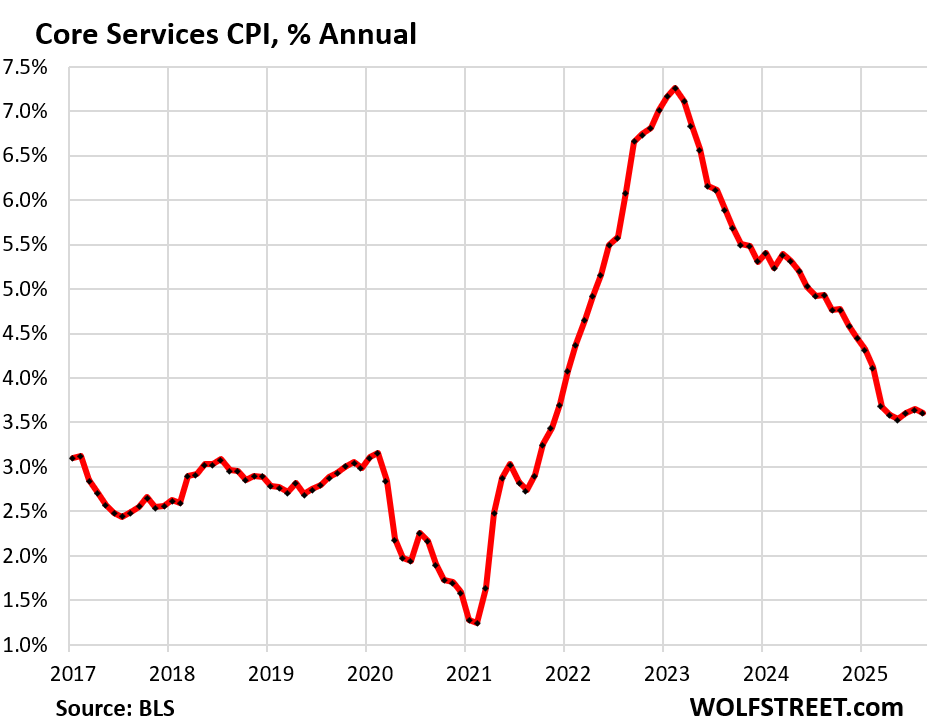
Year-over-year, core services rose by 3.6%, roughly the same year-over-year increases since March.
Housing components of core services.
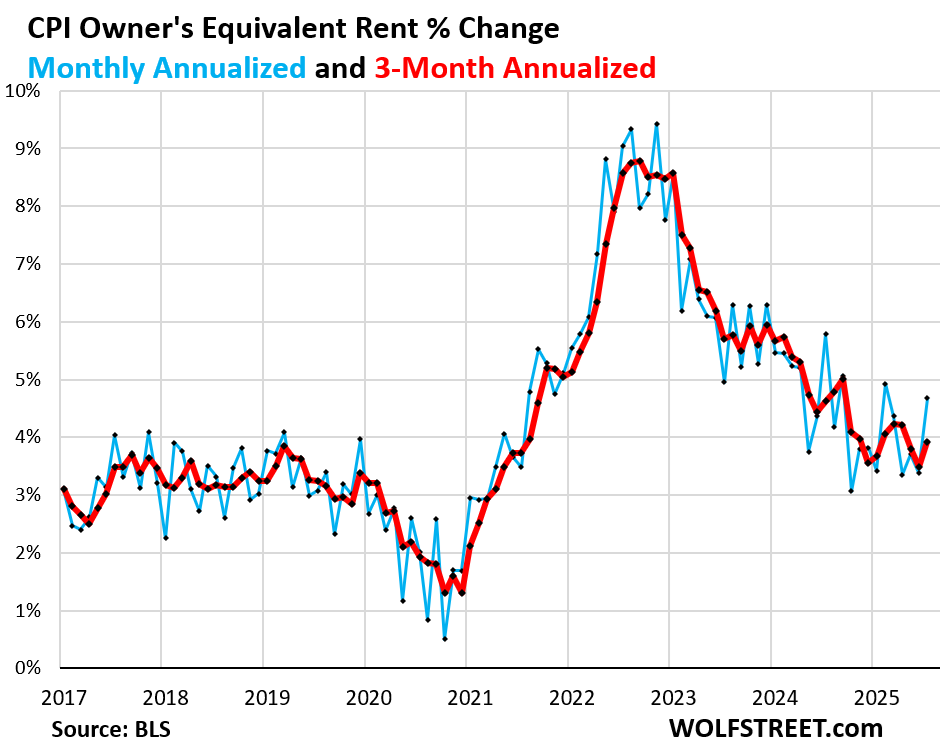
Owners’ Equivalent of Rent CPI jumped by 0.38% (+4.7% annualized) in August from July, the worst increase since February.
The three-month average jumped by 3.9% annualized.
Homeowners are starting to figure in their cost increases. OER indirectly reflects the expenses of homeownership: homeowners’ insurance, HOA fees, property taxes, and maintenance. It’s the only measure for those expenses in the CPI. It is based on what a large group of homeowners estimates their home would rent for, with the assumption that a homeowner would try to recoup their cost increases by raising the rent.
As a stand-in for homeowners’ expenses, OER accounts for 26.2% of overall CPI and estimates inflation of shelter as a service for homeowners.
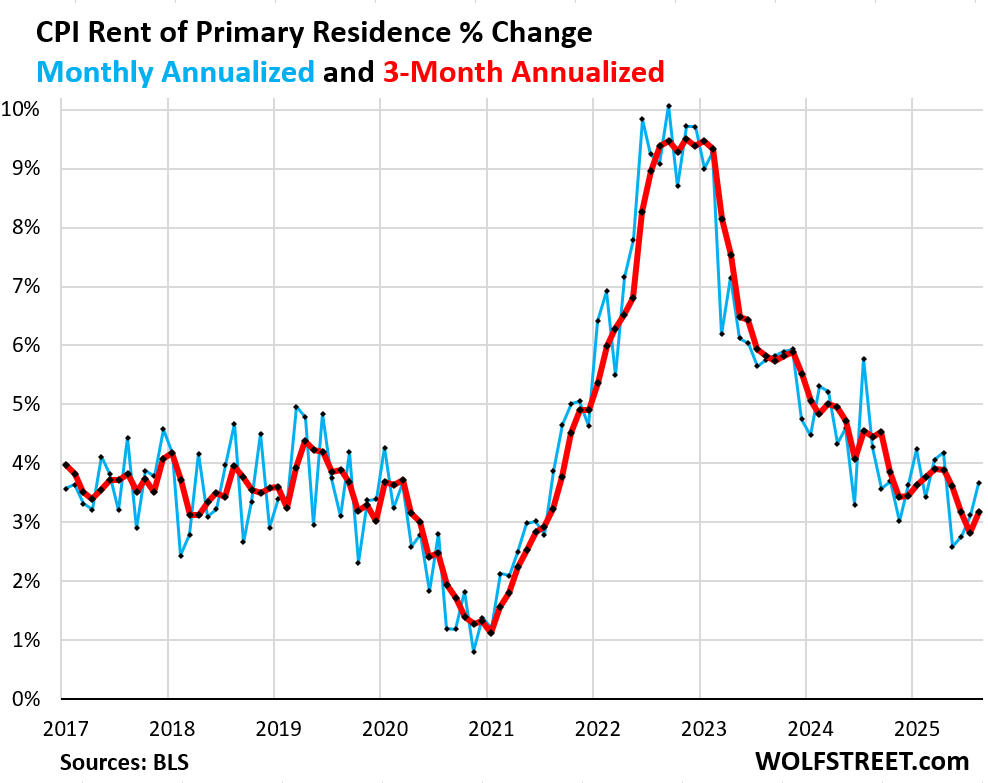
Rent of Primary Residence CPI rose by 0.30% (+3.7% annualized) in August from July, the third acceleration in a row.
The 3-month rate rose by +3.2% annualized, the first acceleration in four months.
Rent CPI accounts for 7.5% of overall CPI. It is based on rents that tenants actually paid, not on asking rents of advertised vacant units for rent. The survey follows the same large group of rental houses and apartments over time and tracks the rents that the current tenants, who come and go, pay in rent for these units.
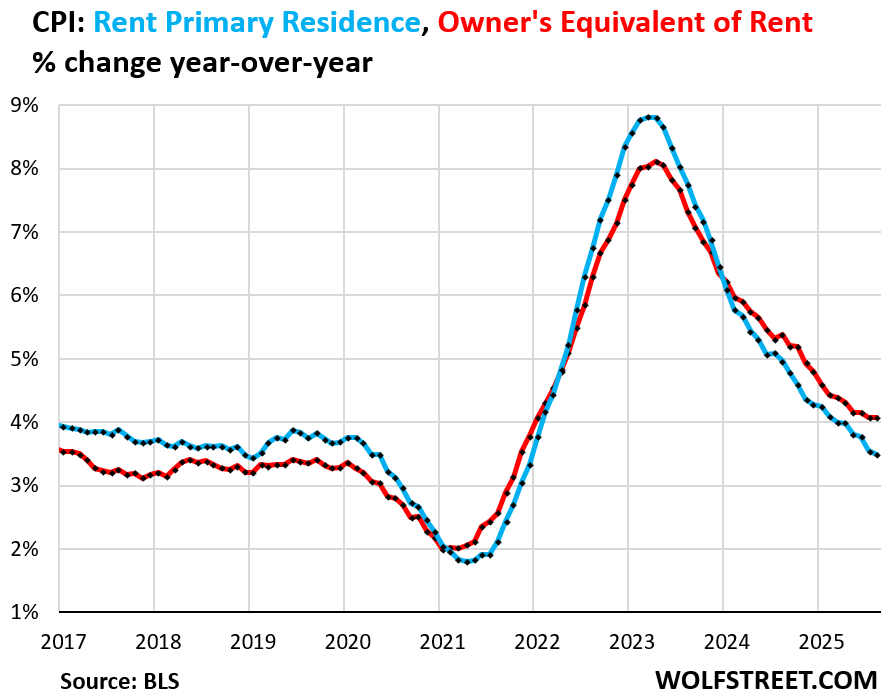
Year-over-year, OER rose by 4.1% for the second month in a row. The deceleration has ended (red in the chart below).
Rent CPI (blue) rose by 3.5% year-over-year, an increase that was just a hair smaller than in the prior month.
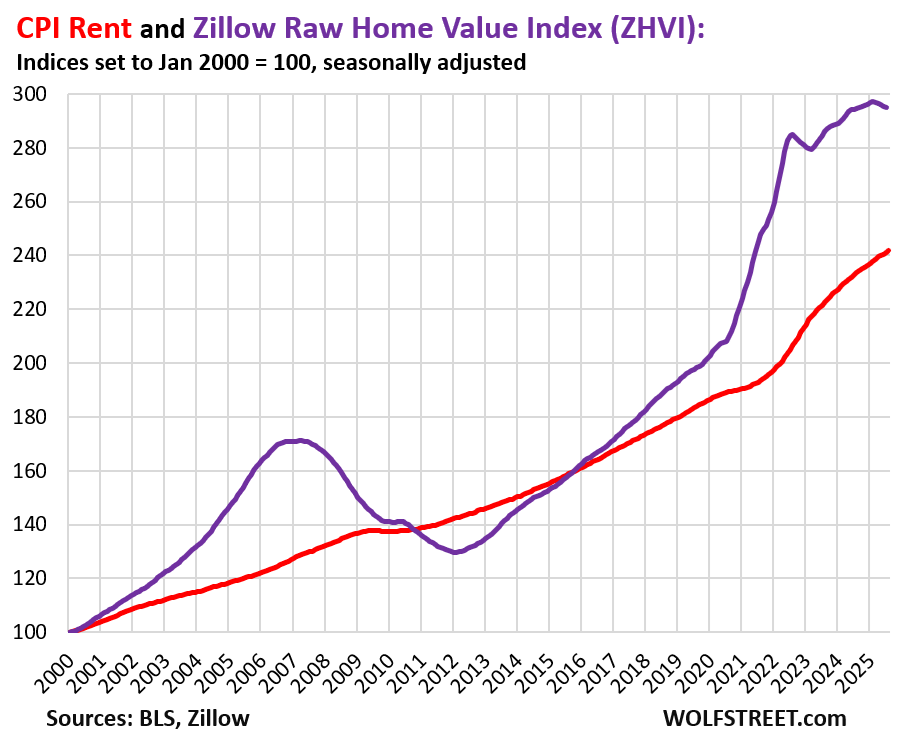
Rents have shot up by 30% since the beginning of 2020. That spike pales compared to the home price explosion of 43%. But home prices peaked early this year on a seasonally adjusted basis and have started to decline since then.
This is the Zillow Home Value Index for all homes, seasonally adjusted (purple) and the CPI for rent (red), both as index values set to 100 for the year 2000.
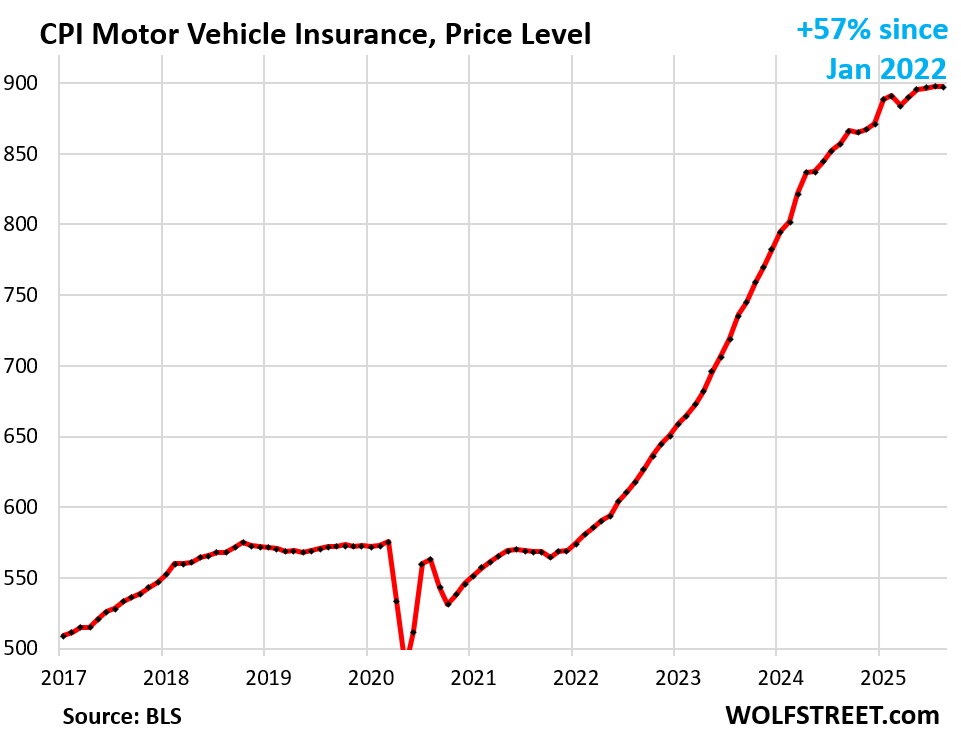
Motor vehicle insurance was unchanged in August from July, but was up by 4.7% year-over-year.
Since the beginning of 2020, the CPI for auto insurance has spiked by 57%, but those increases have cooled for the moment – but it won’t last long because used vehicle prices, which form replacement costs for insurers, are surging again (more in a moment).
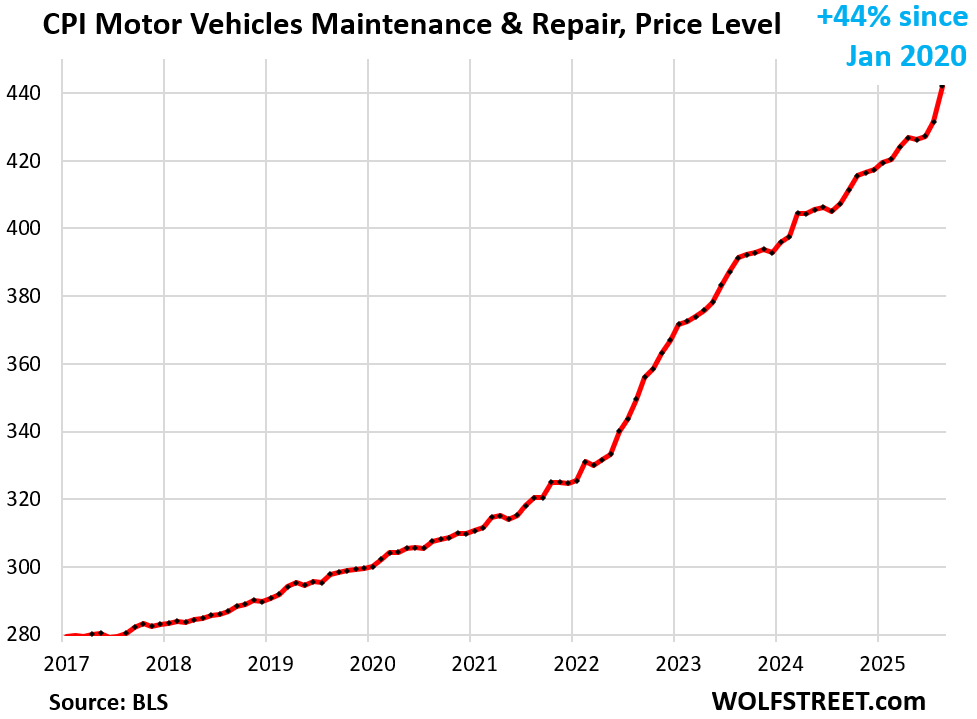
Motor vehicle maintenance & repair shot up by 2.4% in August from July (+33% annualized), and by 8.5% year-over-year.
The index weighs 1.0% in the CPI basket.
Since the beginning of 2020, the CPI for motor vehicle maintenance & repair has spiked by 44%. Compensation for technicians and prices for replacement parts have shot up since early 2020, and tariffs are now piling on top of it.
This is one place where companies have an easier time passing on costs, any costs, including tariffs on parts, and including fatter profit margins, and it shows in the very high profit margins of the parts & service departments of publicly traded auto dealers: When customers need a repair – maybe the vehicle was towed in or is making a scary sound or the A/C went out in August – it’s not that easy to shop around.
The table below shows the major categories of “core services,” and include food services. Combined, they accounted for 64% of total CPI:
| Major Services ex. Energy Services | MoM | YoY |
| Core Services | 0.4% | 3.6% |
| Owner’s equivalent of rent | 0.4% | 4.0% |
| Rent of primary residence | 0.3% | 3.5% |
| Medical care services & insurance | -0.1% | 4.2% |
| Food services (food away from home) | 0.3% | 3.9% |
| Motor vehicle insurance | 0.0% | 4.7% |
| Education (tuition, childcare, school fees) | 0.2% | 3.3% |
| Admission, movies, concerts, sports events, club memberships | -0.1% | 4.3% |
| Other personal services (dry-cleaning, haircuts, legal services…) | 0.1% | 4.4% |
| Public transportation (airline fares, etc.) | 3.6% | 2.2% |
| Telephone & wireless services | -1.0% | -1.7% |
| Lodging away from home, incl Hotels, motels | 2.3% | -2.6% |
| Water, sewer, trash collection services | 0.4% | 5.3% |
| Motor vehicle maintenance & repair | 2.4% | 8.5% |
| Internet services | 1.2% | -0.8% |
| Video and audio services, cable, streaming | -0.6% | 1.6% |
| Pet services, including veterinary | 0.6% | 5.5% |
| Tenants’ & Household insurance | 0.6% | 5.7% |
| Car and truck rental | -6.9% | -4.8% |
| Postage & delivery services | 1.4% | 4.7% |
Goods prices.
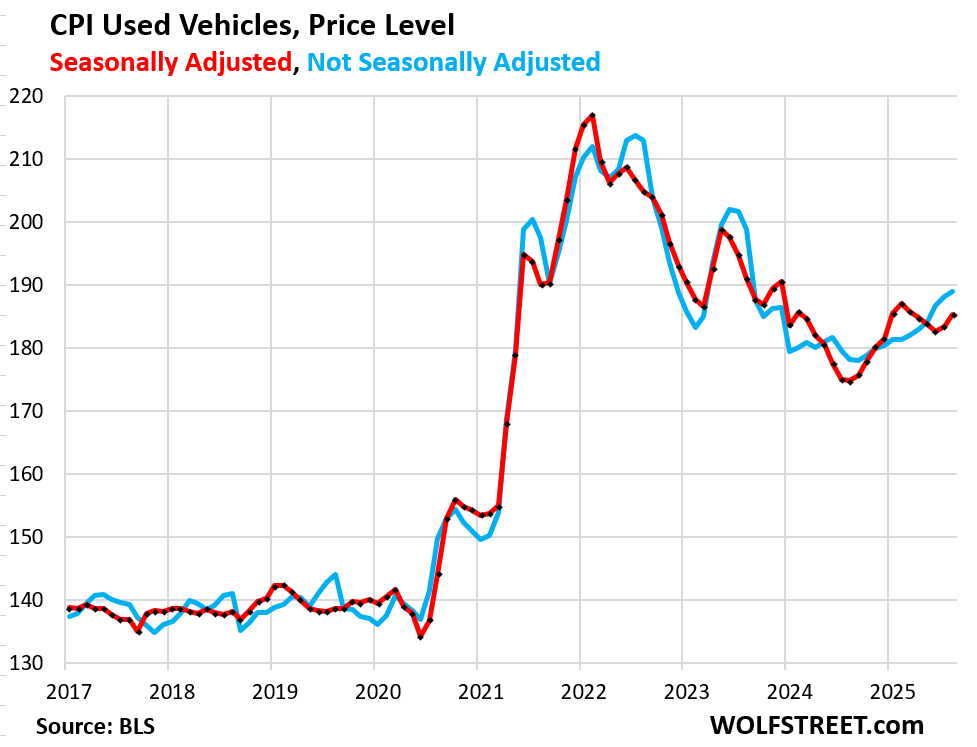
Used vehicle CPI jumped by 1.0% in August from July (+13.2% annualized) and by 6.0% year-over-year. Prices have been rising since mid-2024, after the long drop from the historic spike.
Used vehicles weigh 2.4% in the CPI basket.
I have been discussing this for a year: inventories are tight because of the large-scale production cuts of new vehicles in 2021 and into 2022, that had the effect that somewhere between 8-10 million fewer new vehicles were sold in the US over this period, and those vehicles that hadn’t been produced and sold are now missing from the national fleet and are not flowing into used-vehicle inventory, such as via rental fleets, lease returns, etc. Tight inventories and decent demand ended the price drop in mid-2024, and since then prices have been rising. This has zero to do with tariffs.
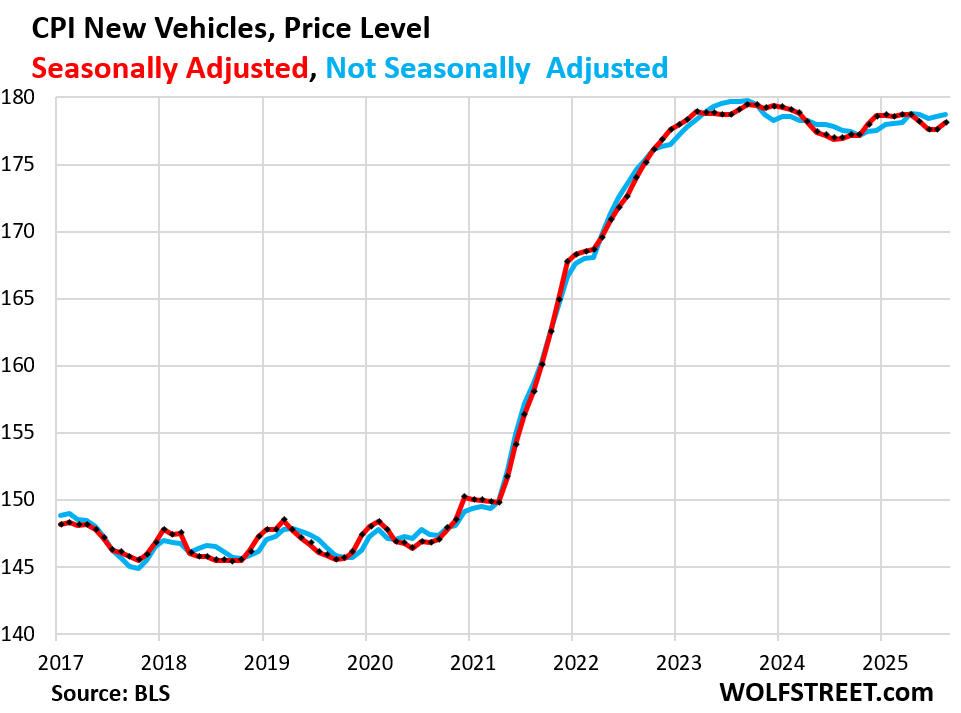
New vehicles CPI rose by 0.28% in August from July, after being unchanged in the prior month, and dropping for the three months before then.
Year-over-year, prices are unchanged. Prices are essentially unchanged since early 2023, after the historic price spike that caused profits at dealers and automakers to blow out.
New vehicles weigh 4.3% in the CPI basket.
Some new vehicles, if imported, are tariffed; and if assembled in the US, some of their imported components are tariffed.
But there are no signs of tariffs getting passed on to consumers. Automakers would love to, but they can’t. All the big automakers have been talking about it in their earnings warnings.
The price spike during the free-money era has made new vehicles too expensive, and now automakers need to throw incentives and discounts at the market to keep sales from falling. It’s a very tough market, and consumers are once again shopping around instead of just paying whatever, which is what they had done during the Free-Money era. And automakers are working on shifting production to the US, but that’s a long slog.
GM, which makes a large portion of its US-sold vehicles in Mexico, China, South Korea, and Canada, and moved much of its supply chains overseas, is among the hardest-hit. Tesla and Honda, whose vehicles are among those with the most US content, are among the least hit.
Durable goods prices overall rose by 0.42% (+5.1% annualized) in August from July, driven mostly by the price spike in used vehicles (+13% annualized).
Year-over-year, the CPI for durable goods rose by 1.9%, also mostly driven by used vehicles (+6.0%).
Inflation in the other durable goods categories is either benign or negative (deflation).
| Major durable goods categories | MoM | YoY |
| Durable goods overall | 0.4% | 1.9% |
| New vehicles | 0.3% | 0.7% |
| Used vehicles | 1.0% | 6.0% |
| Household furnishings (furniture, appliances, floor coverings, tools) | 0.1% | 2.8% |
| Sporting goods (bicycles, equipment, etc.) | 0.1% | -1.3% |
| Information technology (computers, smartphones, etc.) | -0.3% | -5.3% |
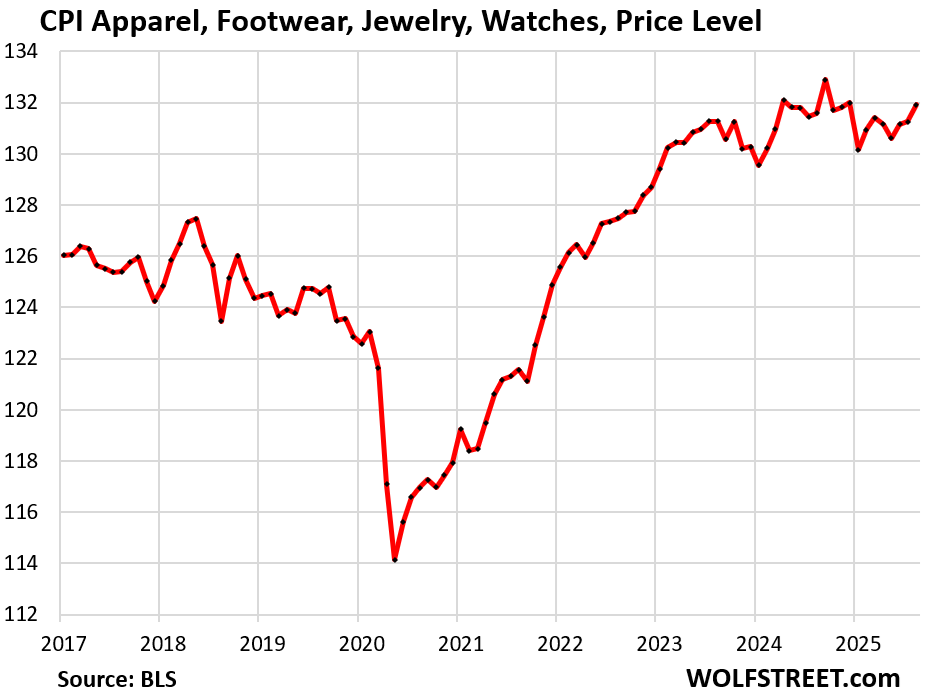
Apparel, footwear, watches, and jewelry are largely imported and tariffed. The CPI for this stuff rose by 0.5% for the month, after being flat in the prior month.
Year-over-year, the index was roughly unchanged. The chart shows the price level (not the percentage change). Find the tariffs:
Food Inflation.
The CPI for “Food at home” jumped by 0.6% in August from July, after dipping in July (-0.1%).
Year-over-year, prices rose 2.7%.
Since January 2020, food prices have surged by 29%.
Beef has been a driver for years as US cattle herds have dropped to a 64-year low for several reasons.
Overall beef prices spiked by 2.7% month-to-month and by 13.9% year-over-year.
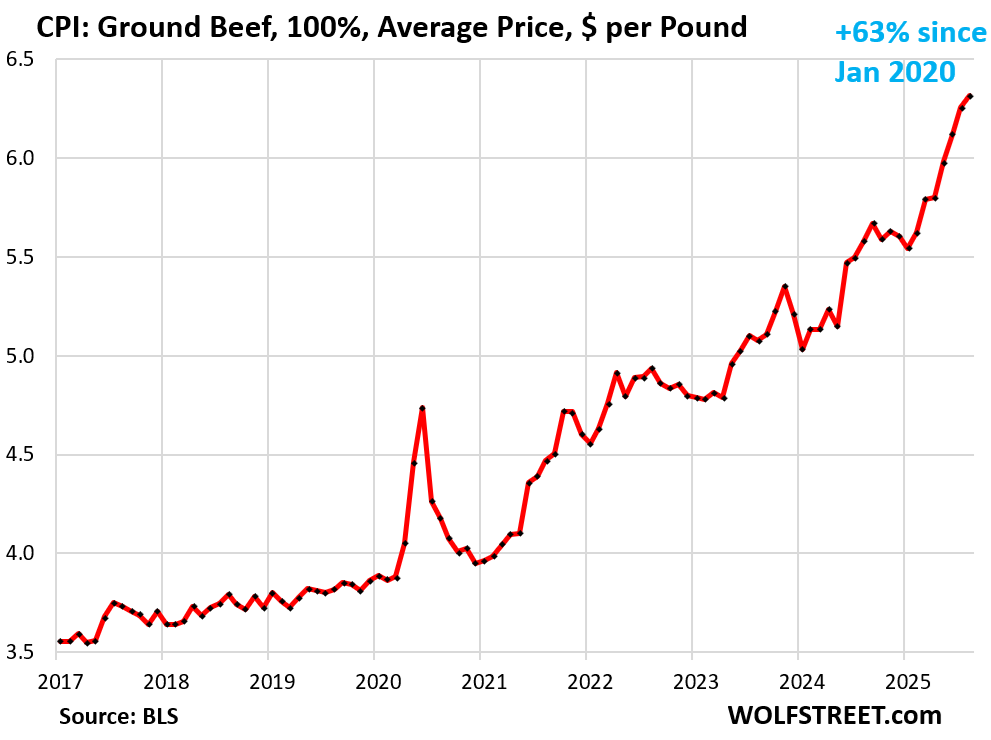
For example, the average price of a pound of ground beef spiked by 1.0% month-over-month and by 13.3% year-over-year, to $6.32.
Since January 2020, the average price of ground beef has spiked by 63%. This is a years-long issue:
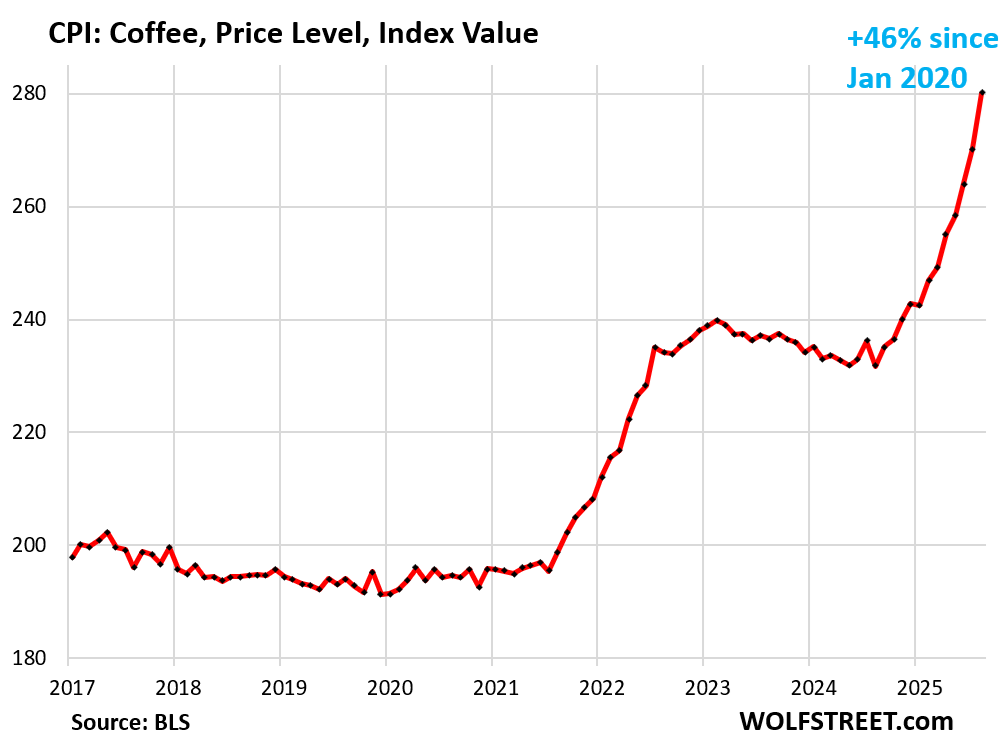
Coffee spiked by 3.6% for the month and by 20.9% year-over-year. Since mid-2021, when this price surge began, the CPI for coffee has surged 46% following global commodity coffee prices:
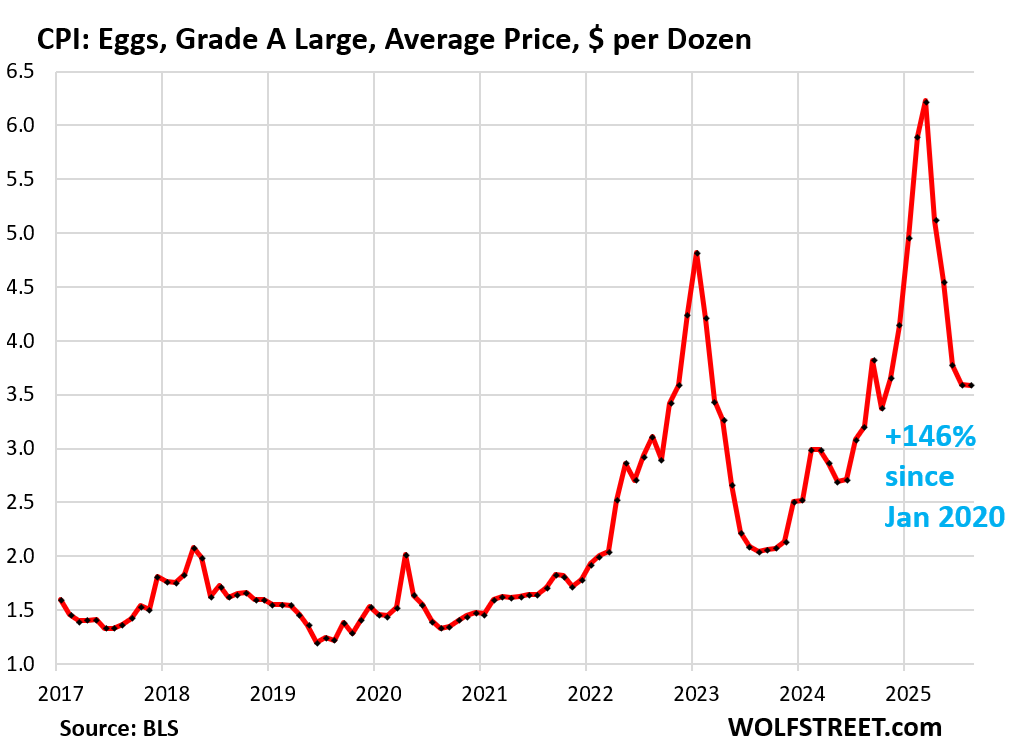
Egg prices overall were unchanged in August from July, after four months of declines, as they unwind their avian-flu-driven price spike. Year-over-year, the index was still up 10.9%.
For example, the average price of a dozen Grade A large eggs dipped 0.3% in August from July, to $3.59 per dozen. That was still up 12% year-over-year.
From the peak in March, they have plunged by 42%.
But they’d spiked so much in two huge waves during the avian flu period through March 2025 that even after this plunge, they’re still up by 146% from January 2020:
| MoM | YoY | |
| Food at home | 0.6% | 2.7% |
| Cereals, breads, bakery products | 0.1% | 1.1% |
| Beef and veal | 2.7% | 13.9% |
| Pork | 0.2% | 1.2% |
| Poultry | -0.7% | 1.7% |
| Fish and seafood | 0.6% | 2.3% |
| Eggs | 0.0% | 10.9% |
| Dairy and related products | 0.1% | 1.3% |
| Fresh fruits | 1.0% | 1.7% |
| Fresh vegetables | 3.0% | 2.9% |
| Juices and nonalcoholic drinks | -0.3% | 1.5% |
| Coffee, tea, etc. | 3.6% | 20.9% |
| Fats and oils | 0.2% | -1.1% |
| Baby food & formula | -0.9% | 0.5% |
| Alcoholic beverages at home | 0.6% | 0.3% |
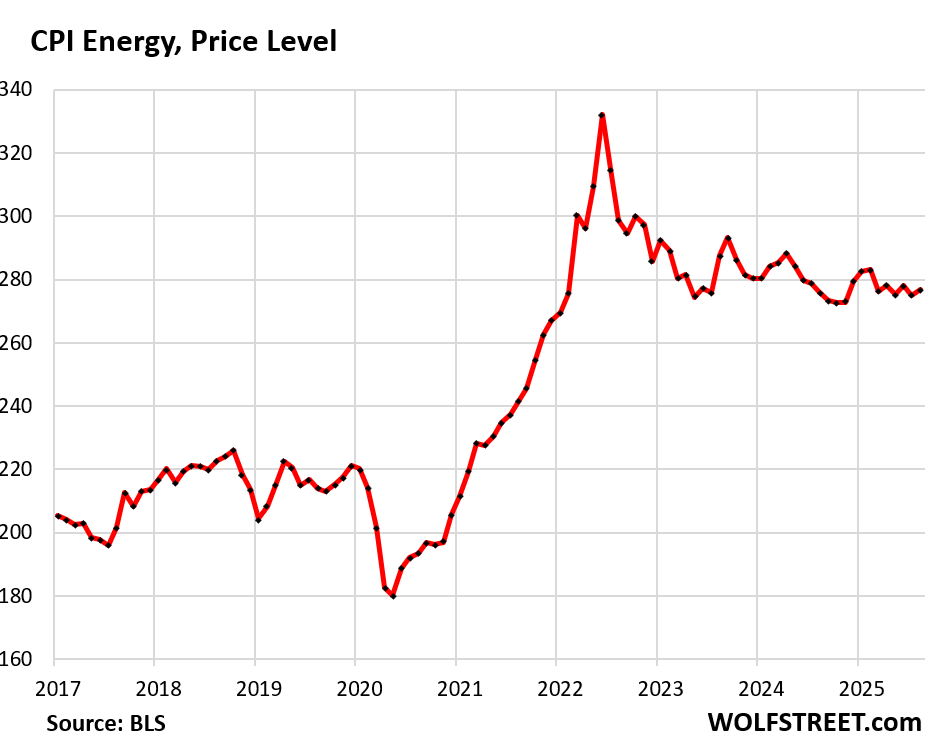
Energy.
The CPI for gasoline jumped by 1.9% month to month, seasonally adjusted. But year-over-year, it was still down by 6.6%, on lower oil prices. Gasoline makes up about half of the overall energy CPI.
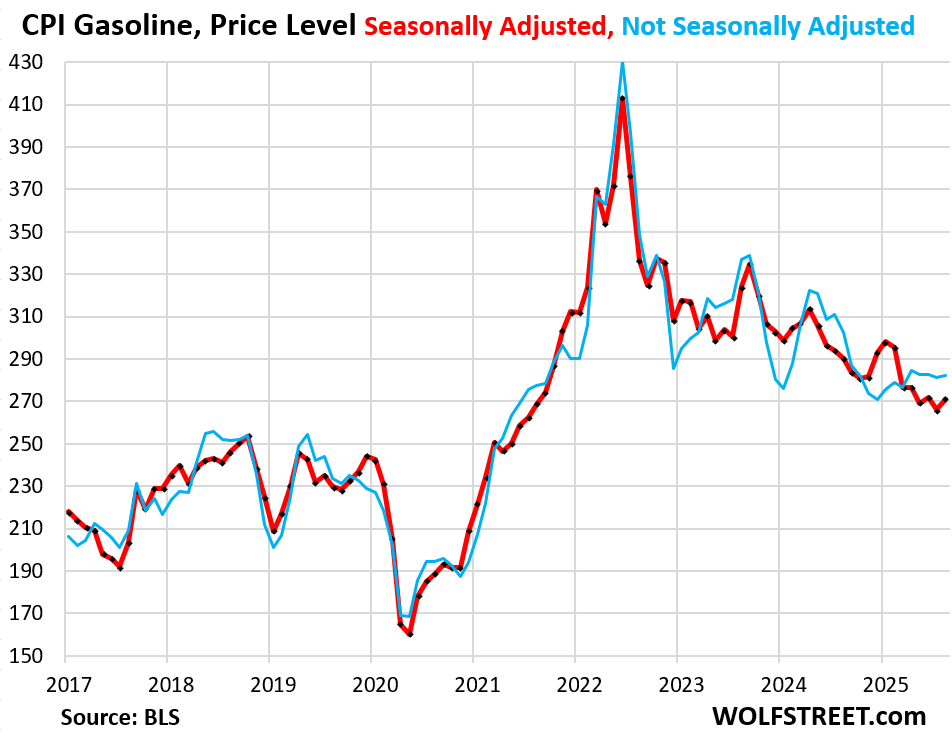
The CPI for energy overall jumped by 0.7% in August from July but was roughly unchanged year-over-year. Note the year-over-year surge in electricity services and natural gas piped to the home.
| CPI for Energy, by Category | MoM | YoY |
| Overall Energy CPI | 0.7% | 0.2% |
| Gasoline | 1.9% | -6.6% |
| Electricity service | 0.2% | 7.7% |
| Utility natural gas to home | -1.6% | 13.8% |
| Heating oil, propane, kerosene, firewood | -1.1% | -0.8% |
Overall energy prices that consumers pay for directly have plunged by 17% from the peak in mid-2022 but are still far higher than before the pandemic:
Enjoy reading WOLF STREET and want to support it? You can donate. I appreciate it immensely. Click on the mug to find out how:

![]()
Source link

