A spatiotemporally resolved atlas of the Arabidopsis life cycle
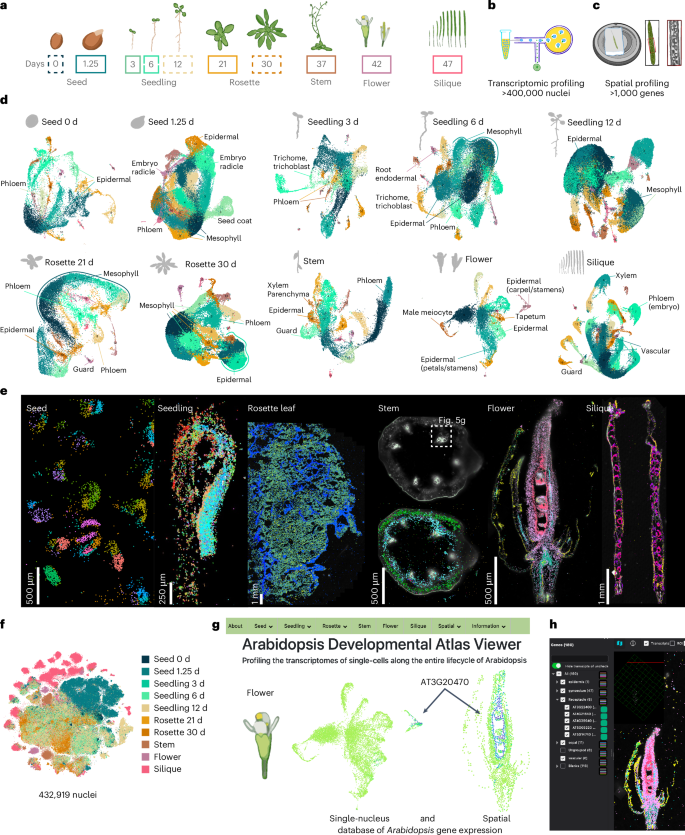
To generate a comprehensive atlas of Arabidopsis development, we collected six distinct organ systems that encompass diverse tissues as well as whole organisms at ten discrete developmental time points throughout the Arabidopsis life cycle corresponding to established developmental road maps28,29,30. This includes imbibed and germinating seeds, three stages of seedling development, developing and fully emerged rosettes, the stem, flowers and siliques (Fig. 1a). For each organ system, we also generated a paired spatial transcriptomic dataset (Fig. 1b–e; mature rosette leaf27). For the single-nucleus datasets, 432,919 nuclei from the ten developmental time points passed accepted droplet-based single-nucleus filtering metrics31 (median unique molecular identifier (UMI), 916; Extended Data Fig. 1 and Supplementary Fig. 1) and were independently clustered. For the seedling and rosette samples that constitute developmental time series, we also performed integrative analyses that revealed clusters corresponding to known cell types (Extended Data Fig. 1c,d), which confirms the reproducibility of these datasets and enables the investigation of developmentally regulated processes, such as root hair development (Supplementary Fig. 2) and leaf senescence (Supplementary Fig. 3), as reported recently20, across developmentally distinct samples. We also merged all single-nucleus RNA sequencing (snRNA-seq) datasets into a global dataset (Fig. 1f) encompassing all cell types across the Arabidopsis life cycle.
a, The collected tissues over the ten developmental time points spanning the plant life cycle, including imbibed and germinating seeds (0 days and 1.25 days); three stages of seedling development (3 days, 6 days and 12 days); developing and fully expanded rosettes (21 days and 30 days); the stem (37 days), including basal, apical and branched regions; flower tissue (stages 6–15; ref. 30); and siliques (stages 2–10; ref. 29). Developmental time points surrounded by solid lines denote matching single-nucleus and spatial transcriptomic datasets. b,c, Paired single-nucleus and spatial transcriptomic datasets generated in our study. d, Uniform manifold approximation and projection (UMAP) plots of each dataset with select cluster annotations displayed for each dataset. e, Spatial transcriptomic assays analysed in this study, including Arabidopsis seed, seedling, mature leaf, stem, flower cross and longitudinal sections, and silique. The scale bar lengths are shown. f, t-distributed stochastic neighbour embeddings of the fully integrated dataset. Nuclei are coloured according to the tissue of origin. g, Web browser access to the Arabidopsis Developmental Atlas Browser and CELLxGENE instances of flower single-nucleus and spatial datasets. h, A spatial transcriptomic dataset within the MERSCOPE Visualizer software. For each micrograph in e, results were observed across ten independent seeds, eight independent seedlings, two independent leaves, one stem, three independent flowers (one in longitudinal orientation and two in cross orientation) and three independent siliques. See Methods for detailed information.
Comprehensive identification of transcriptional identities
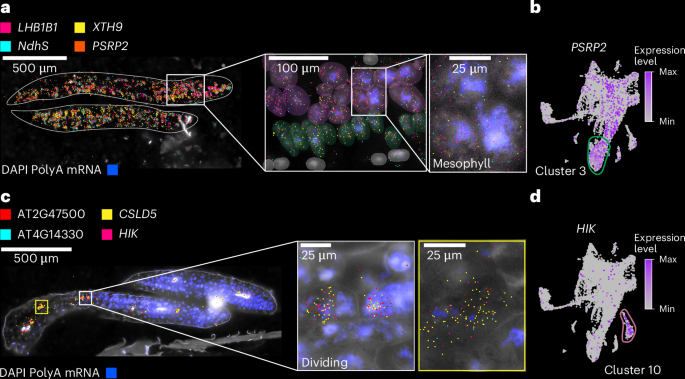
To compare cell types across organs and development, we analysed each dataset independently, which resulted in 183 clusters across all datasets (Fig. 1d). Cluster annotation was performed according to the following guidelines. First, an extensive list of marker genes was compiled with known cell-type- and tissue-specific expression in all Arabidopsis organs (Supplementary Table 1), including cell-type-specific markers recently identified from single-cell RNA-seq studies18,19,32,33,34,35. Many of these known cell-type-/tissue-specific expressed genes were enriched in specific clusters of our dataset (>1,000 genes), which aided cluster annotation (Supplementary Fig. 4a). Second, a cell-type enrichment score for each cluster was calculated on the basis of known cell-type markers to systematically infer cell types (Methods and Supplementary Fig. 4b). Third, we investigated newly identified cluster markers within each dataset using previously generated dissection-based and cell-type-specific transcriptomic studies (TAIR36 and ePlant37,38) to confirm the accuracy of our cluster annotations (Supplementary Table 2). Finally, we spatially validated a selection of cluster markers for each tissue/organ using sequencing- and imaging-based spatial transcriptomic technologies (Fig. 2 and Extended Data Figs. 2–6).
a, Spatial transcriptomic visualization of selected gene expression (LHB1B1 (AT2G34430), XYLOGLUCAN ENDOTRANSGLUCOSYLASE/HYDROLASE 9 (XTH9; AT4G03210), NAD(P)H dehydrogenase subunit S (NdhS; AT4G23890) and PLASTID-SPECIFIC RIBOSOMAL PROTEIN 2 (PSRP2; AT3G52150)) in the Arabidopsis seedling (zoomed in on the cotyledons). The higher-magnification images highlight the localization of transcripts within mesophyll cells. DAPI staining (blue) indicates nuclei. The scale bar lengths are shown. b, UMAP plot of single-nucleus transcriptomes showing expression of PSRP2 (purple dots), enriched in cluster 3 (outlined in green). c, Spatial mapping of cluster 10 annotated as ‘dividing cells’ in the three-day-old seedling, with transcripts from known and new cell-cycle- and division-related genes (AT2G47500, CSLD5 (AT1G02730), AT4G14330 and HIK (AT1G18370), marked in magenta, yellow, cyan and pink, respectively). The insets show individual dividing cells with colocalized transcripts. DAPI staining (blue) indicates nuclei. The scale bar lengths are shown. d, UMAP plot highlighting expression of HIK enriched in cluster 10 (outlined in purple), corresponding to dividing cells in the tissue. For the micrographs in a and c, results were observed in eight seedlings. DAPI, 4′,6-diamidino-2-phenylindole.
Our spatial transcriptome approach allowed us to validate examples of known cell-type marker genes across organs and development, as well as validate newly identified cell-type-specific and tissue-specific marker genes across all organs (see Supplementary Table 3 for 109 examples of new cell-type/tissue marker genes). In contrast, we were also able to identify and validate markers that do not universally specify cell types but rather demonstrate cell-type-specific expression only within the context of specific organs, as shown for epidermal cells of seedling hypocotyls (Extended Data Fig. 3b). Spatial transcriptomics confirmed the localization of cell-type-specific genes identified via snRNA-seq in most developmental stages and plant organs tested (Extended Data Figs. 2–6). In the seedling datasets, we were able to confirm cell identities such as mesophyll cells expressing LIGHT-HARVESTING CHLOROPHYLL-PROTEIN COMPLEX II SUBUNIT B1 (LHB1B1; AT2G34430)38, epidermal cells (for example, GLYCOSYL HYDROLASE 9B8 (GH9B8; AT2G32990) and AT2G12462, new epidermal markers restricted to the apical hook and cotyledons in seedlings, respectively) and vascular cells (AINTEGUMENTA (ANT; AT4G37750), which was shown to regulate ERECTA-LIKE 1 (ERL1; AT5G62230) and PHLOEM INTERCALATED WITH XYLEM (PXY; AT5G61480), which maintain procambial cell identity39) that are co-expressed in the same cluster as SUCROSE-PROTON SYMPORTER 2 (SUC2; AT1G22710)40,41,42 (Fig. 2 and Extended Data Fig. 3). We were also able to annotate clusters to cell states through the cluster-specific expression of cell-division-associated genes such as CELLULOSE SYNTHASE LIKE-D (CSLD5; AT1G02730), involved in cell plate formation43, and HINKEL (HIK; AT1G18370), which is involved in cytokinesis44 (Fig. 2 and Extended Data Fig. 3).
Visual inspection of spatial marker expression within the single-nucleus datasets did not always reveal cluster-specific expression patterns, as demonstrated by LHB1B1 (Extended Data Fig. 3g), but quantitative evaluation of these markers revealed cluster- and subcluster-specific and enriched expression of these spatial markers both within individual samples (Extended Data Fig. 3k, left) and across tissues and developmental time points (Extended Data Fig. 3k, right), demonstrating conserved expression of these cell-type and cell-state markers across diverse tissues throughout the Arabidopsis life cycle.
In stems, we identified cell-type-specific gene expression localized to the procambium (for example, USUALLY MULTIPLE AMINO ACIDS MOVE IN AND OUT TRANSPORTERS 11 (UMAMIT11; AT2G40900)), cortex (for example, B-BOX DOMAIN PROTEIN 15 (BBX15; AT1G25440)), phloem (H(+)-ATPase 3 (refs. 45,46) (HA3; AT5G57350)) and xylem tissues (XYLEM CYSTEINE PEPTIDASE 2 (XCP2; AT1G20850) and IRREGULAR XYLEM 3 (ref. 47) (IRX3; AT5G17420)), enabling high-resolution mapping of vascular differentiation in the stem (Extended Data Fig. 4). Spatial expression of markers in Arabidopsis floral tissue revealed epidermal markers (for example, AT2G37540), vascular-expressed genes (for example, FLOWERING LOCUS T (FT; AT1G65480)) and carpel-specific expression of AGAMOUS-like 8 / FRUITFULL (AT5G60910; ref. 48) (Extended Data Fig. 5). Spatial transcriptomics also revealed distinct expression domains within the Arabidopsis silique, with VEGETATIVE STORAGE PROTEIN 2 (VSP2; AT5G24770) and the TPX2 protein family (TPXL6; AT5G37478) marking the exocarp cell layer, and AT2G13810 showing specific localization in developing seeds (Extended Data Fig. 6). Together, these examples demonstrate the strength of our paired single-nucleus and spatial transcriptomic datasets on matched biological samples.
While we were able to annotate many clusters to individual cell types, we found that some clusters instead corresponded to anatomical regions or broad cellular states, such as the developing embryo or dividing cells (Supplementary Table 2). This led us to hypothesize that further transcriptional complexity could be resolved within each cluster when examined independently. Through systematic re-clustering of individual clusters (subclustering), we were able to determine further complexity within clusters, resulting in a total of 655 subclusters (Supplementary Fig. 5a). Correlating the aggregated transcriptomes (pseudobulk) of each subcluster, we found that subclusters generally grouped by sample type, but we also found examples of subclusters with unique gene expression patterns that grouped independent of dataset (Supplementary Fig. 5b). Together, these results demonstrate that subclustering captures subtle transcriptional states and uncovers rare or transitional cell populations that may play distinct roles across developmental or environmental contexts.
Spatially resolved cell layer annotation
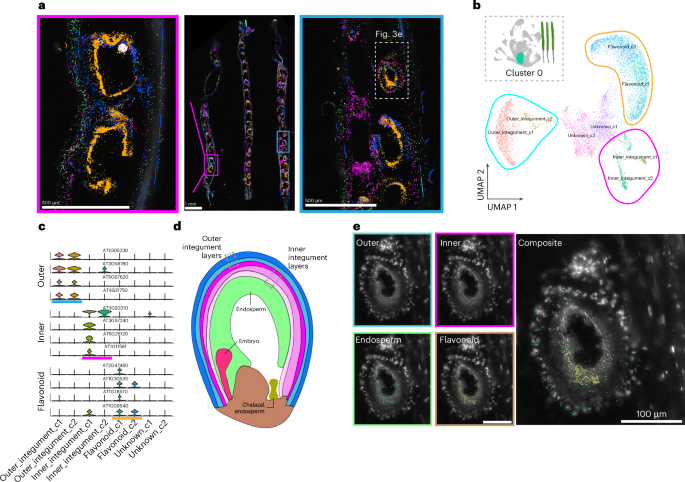
The silique represents a complex system that includes distinct maternal and progeny tissues. We therefore used the silique dataset as a use case example of dataset annotation that is enhanced by the paired single-nucleus and spatial transcriptomic datasets (Fig. 3a). Within the proliferating cell population (cluster 0) that may encompass multiple cell types in siliques, subclustering revealed three transcriptionally distinct groups, with each defined by unique marker genes (Fig. 3b,c). Expression of these markers was restricted to the seed coat layer49, prompting further spatial investigation.
a, Visualization of all 43 transcripts targeted with MERFISH in siliques. Groups of transcripts are false-coloured according to cell type and region-specific expression. Magnified images of individual seed sacs are also depicted. The scale bar lengths are shown. b,c, Subclustering of cluster 0 from the silique dataset. Groups of clusters corresponding to the outer integument (blue), inner integument (pink) and flavonoid biosynthesis (orange) clusters are depicted (b), with violin plots of select cluster markers (c). d, Relevant cell types and structures of developing seed sacs. e, Magnified images of an individual seed sac in the spatial dataset. Subcluster markers are coloured corresponding to the annotated cluster grouping. The scale bar length is shown. For the micrographs in a and e, results were observed in three siliques and at least ten seed sacs within the siliques.
By mapping these markers in the spatial dataset, we were able to finely annotate subcluster groups corresponding to the seed coat’s outer and inner integument layers (Fig. 3a,d,e). This annotation of individual layers within developing seeds was further supported by a similar annotation of these genes in a single-nucleus transcriptome dataset of Arabidopsis seeds35. Consistent with a previous single-nucleus dataset of developing seeds35, we also identified subcluster markers corresponding to flavonoid biosynthetic processes within our subcluster groups (Fig. 3b,c and Supplementary Fig. 6), but spatial mapping revealed that these transcripts are detected in both the seed coat and endosperm layers of seed sacs (Fig. 3e, beige). While flavonoid secondary metabolites are known to function in seed coat colour and cause the transparent testa phenotype in mutants of flavonoid biosynthetic enzymes50,51, the spatial expression of TRANSPARENT TESTA 4 (TT4; AT5G13930) and other flavonoid biosynthesis genes within the endosperm layer may instead be associated with the alteration of fatty acid levels in embryos. This has been observed in tt2 (AT5G35550)52, tt4 (AT5G13930)53 and tt8 (AT4G09820)54 mutants. The simultaneous but spatially distinct expression of genes encoding flavonoid biosynthesis enzymes may suggest functionally diverse roles of flavonoid metabolites within discrete cell types of individual seeds. Together, these findings demonstrate that transcriptional states may be strongly associated with secondary metabolite production and inclusive of multiple cell types, further demonstrating that the paired application of single-nucleus and spatial transcriptome datasets enables the discovery and annotation of marker genes at the resolution of individual cell layers.
Elucidation of polarity defines cellular states
Spatially confined expression of polarity regulators is a hallmark of de novo organogenesis in various Arabidopsis organs10,55,56. We hypothesized that our Arabidopsis life-cycle atlas would capture polarity-defined cells. In our single-nucleus datasets, we detected transcripts of canonical polarity markers across several clusters (Supplementary Fig. 7), suggesting the presence of such cells within our datasets. However, these transcripts were sparsely expressed, limiting our ability to fully resolve polarity domains on the basis of single-nucleus data alone (Supplementary Fig. 7).
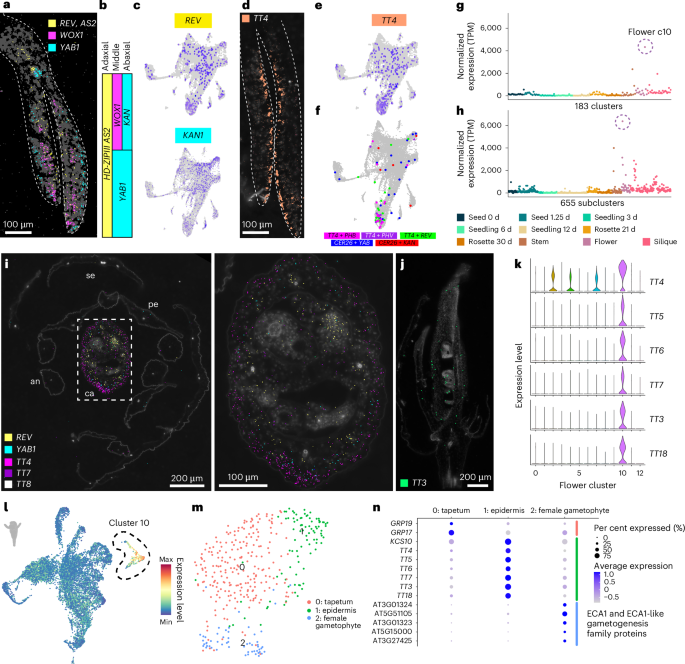
To overcome this limitation, we leveraged our spatial transcriptomics dataset and examined the expression of known polarity regulators in our three-day-old seedling dataset. We detected transcripts of known polarity regulators in expected regions of cotyledons and were able to spatially reconstruct the three-domain model of leaf development57,58 with the detection of REVOLUTA (REV; AT5G60690), WUSCHEL-related homeobox 1 (WOX1; AT3G18010) and YABBY1 (YAB1) / ABNORMAL FLORAL ORGANS (AFO) (AT2G45190) in the adaxial, middle and abaxial domains of cotyledons, respectively (Fig. 4a–c).
a, Spatial locations of transcripts of the three-domain model of leaf development in cotyledons of the three-day-old seedling spatial transcriptome dataset. The scale bar length is shown. b, Simplified three-domain model of leaf development5. c, Expression of organ polarity regulators REV and KAN1 in the single-nucleus three-day-old seedling dataset. d,e, Expression of TT4 in the spatial (d) and single-nucleus (e) datasets of three-day-old seedlings. The scale bar length is shown. f, Identification of nuclei with co-expression of canonical polarity regulators and transcripts with polar expression patterns in the three-day-old seedling spatial transcriptome dataset. g,h, Normalized pseudobulk expression of TT4 in all 183 major clusters (g) and all 655 subclusters (h). The points are coloured according to dataset. TPM, transcripts per million. i, Spatial expression of organ polarity regulators REV and YAB1 and flavonoid biosynthesis enzymes TT4, TT7 and TT8 in a flower cross section. Right, zoomed-in image of the carpel. The scale bar lengths are shown. se, sepal; an, anther; pe, petal; ca, carpel. j, Spatial expression of TT3 in a longitudinal section of a flower. The scale bar length is shown. k, Expression of the flavonoid biosynthesis enzymes TT4–7, TT3 and TT18 in clusters of the single-nucleus flower dataset. l, Average expression of all enzymes of the flavonoid biosynthesis pathway in the flower single-nucleus dataset. Cluster 10, which shows restricted expression of these transcripts, is circled. m,n, Subcluster results and expression of cell-type markers in cluster 10 of the flower dataset. For the micrographs in a and d, results were observed in eight seedlings. For the micrographs in i and j, results were observed in two cross-sectioned flowers and one longitudinally sectioned flower.
We identified new marker genes that were spatially co-expressed in regions of known polarity regulators, as exemplified by TT4, which was detected prominently and solely within the adaxial region of cotyledons (Fig. 4d and Supplementary Fig. 8). Furthermore, TT4 transcripts were more abundant than those of the canonical adaxial polarity regulators REV and AS2 (Fig. 4a,d), which could be because canonical polarity regulators encode transcription factors that are known to be expressed at lower levels in cells. Despite low detection of canonical polarity regulators in our single-nucleus datasets (Fig. 4c and Supplementary Fig. 7), we were able to identify nuclei that co-expressed polarity regulators with TT4 (Fig. 4e) and other spatially validated transcripts with polar expression patterns for both abaxial and adaxial defined cells (Fig. 4f and Supplementary Fig. 9), in addition to known cell-type markers (Supplementary Fig. 10). These results demonstrate that these new markers with polar expression patterns in cotyledons denote polarity-defined cells (polarity positive), which is supported by the observation that the mutation of individual TRANSPARENT TESTA genes affects the development of specific cell types in seedlings59.
While the polarity-positive nuclei were not restricted to individual clusters (Fig. 4f), we instead found that the expression of canonical and newly identified polarity markers was more defined at the subcluster level (Fig. 4g,h). Together, these results reveal that polar specification demarcates cell subpopulations within individual cell types and may further explain the observed subcluster diversity (Supplementary Fig. 5).
Organ-specific arrangement of cell identities
While TT4 exhibited prominent adaxial localized expression in cotyledons of three-day-old seedlings, examining TT4 expression across all organs and developmental stages revealed that TT4 expression was the greatest in several flower clusters (Fig. 4g,h), which prompted us to examine the expression and spatial distribution of TT4 within flowers. Consistent with prior findings, we found that transcripts of canonical polarity markers were spatially restricted to the expected adaxial (REV, yellow) and abaxial (YAB1 (ref. 60), cyan) regions of the carpel (Fig. 4i). Interestingly, in contrast to our findings in cotyledons (Fig. 4a), we found that TT4 transcripts were instead localized to abaxial layers of carpels (Fig. 4i). As TT4 encodes the sole enzyme involved in chalcone synthesis50 upstream of flavonoid biosynthesis, we hypothesized that genes encoding other enzymes in the flavonoid biosynthetic pathway may also be spatially regulated in flowers. We found that the expression of other flavonoid biosynthesis genes (TT3–7, LEUCOANTHOCYANIDIN DIOXYGENASE (LDOX) / TT18 (AT4G22880) and FLAVONOL SYNTHASE 1 (FLS1; AT5G08640)) was enriched in the same flower cluster (Fig. 4k,l; cluster 10) and spatial regions as that of TT4 (Fig. 4i,j), which suggests that the expression of entire secondary metabolite biosynthesis pathways may influence the transcriptional identity of individual cells (Fig. 4k). While we observed the highest expression of the flavonoid biosynthetic pathway within flower subclusters, some (but not all) organs were associated with clusters that specifically express flavonoid biosynthesis genes, revealing specific roles of flavonoids in specific organs throughout the Arabidopsis life cycle (Supplementary Fig. 11).
Because flavonoids have diverse roles in several biological processes in various flower tissues61, we questioned whether the flower cluster associated with high expression of flavonoid biosynthesis enzymes, which we consistently observed with altered clustering parameters (Supplementary Figs. 12 and 13), may instead represent diverse cell types that all produce flavonoids in contrast to a single cell type. Subclustering of the flavonoid biosynthetic cluster (cluster 10; Fig. 4m) revealed three subcluster populations that were enriched for markers of tapetum62 (subcluster 0, GLYCINE RICH PROTEINS), epidermal63 (subcluster 1, 3-KETOACYL-COA SYNTHASE 10 (KCS10; AT2G26250) and TRANSPARENT TESTA genes) and female gametophyte64 (subcluster 2, ER-TYPE Ca2+-ATPase 1 (ECA1) and ECA1-like gametogenesis family genes) cells (Fig. 4m,n). Together, these results highlight an example of transcriptional complexity driven by the expression of secondary metabolism pathways among several cell types, where cell-type identity is resolved only at the resolution of subclusters.
Cell-type-specific and organ-specific genes define the transcriptional identities of cells
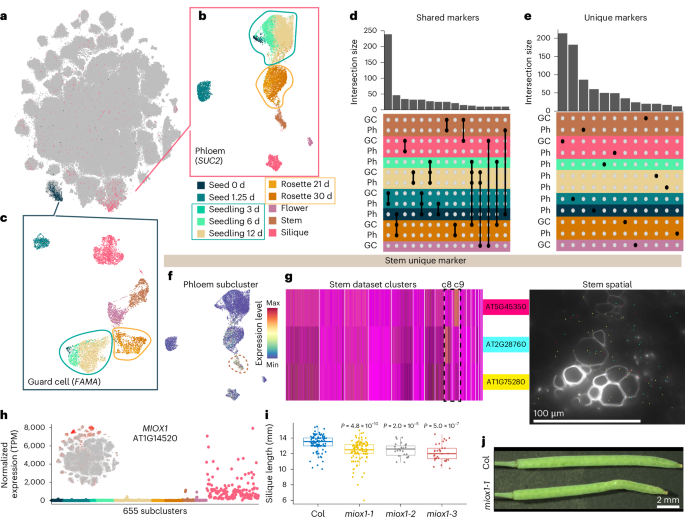
In the integrated global dataset (Fig. 1f), we identified at least ten clusters that correspond to recurrent cell types, such as vascular (phloem), epidermal (epidermis, guard cells and trichomes) and meristematic (procambium) cell types, that are represented by nuclei from all tissues and developmental time points assayed in which those cell types are present (Supplementary Fig. 14a,b). While these recurrent cell types could be identified by the cluster-specific expression of individual or suites of cell-type markers, we questioned whether heterogeneity within individual cell types may exist at the whole-transcriptome level. We initially focused on phloem companion and guard cells that were identified by the specific expression of the phloem and guard cell marker genes SUC2 (AT1G22710; refs. 41,42) and FAMA (AT3G24140; ref. 65), respectively (Fig. 5a). Independent subclustering of the phloem companion (Fig. 5b) and guard cell populations from the global dataset (Fig. 5c) revealed subcluster complexity within both of these cell types. We observed similar trends within both the phloem companion and guard cell populations, where nuclei from both the seedling and rosette time-series datasets formed individual aggregate clusters (Fig. 5b,c; circled). In contrast, nuclei from other organs, exemplified by silique nuclei, generally clustered separately (Fig. 5b,c), which suggests that organ-specific transcripts contribute to the observed complexity within individual cell types. Examining populations of other recurrent cell types identified from the global dataset (Supplementary Fig. 14a–c) consistently revealed similar trends where silique nuclei clustered separately from those of different organs. From these findings, we hypothesized that the observed heterogeneity within cell types may be due to (1) genes with expression that is restricted to individual organs or developmental time points yet expressed within multiple cell types, or (2) genes with expression under the dual regulation of cell-type and organ or developmental specificity.
a, t-distributed stochastic neighbour embedding of the global dataset with expression levels of the stomatal lineage marker FAMA (blue, AT3G24140) and the phloem marker SUC2 (pink, AT1G22710). b,c, Re-clustering of the phloem (b) and guard cell (c) lineage clusters. Cells are coloured according to tissue of origin. Seedling-derived and rosette-derived clusters are circled in blue and orange, respectively. d, Quantification of subcluster markers shared between phloem and guard cell lineage subclusters. Groups of subclusters with more than ten overlapping subcluster markers are depicted. The black dots indicate the overlapping groups of subclusters. Colour indicates the dataset of origin with the highest proportion of cells for each subcluster. e, Quantification of markers uniquely identified as subcluster markers in only phloem and guard lineage cell subclusters. Subclusters with at least ten uniquely identified genes are depicted. f,g, Expression of markers uniquely identified in phloem companion cells of the stem dataset. Panel f shows the average expression of all markers uniquely identified in stem phloem companion cells. Cluster 9 of the phloem companion cell analysis (Fig. 5b) with maximal expression is circled. Panel g shows the expression of three stem phloem companion cell markers in the single-nucleus dataset (left) and the magnified region depicted in Fig. 1e of a vascular bundle in the stem spatial transcriptomic dataset (right). The scale bar length is shown. h, Normalized pseudobulk expression of MIOX1 (AT1G14520) across 655 subclusters. The points are coloured according to dataset. i, Quantification of the length of fully elongated siliques in Col-0 and three miox1 T-DNA mutants. n > 9 individual fully elongated siliques were measured from individual plants for each genotype. Siliques from eight plants were measured for Col-0 and the miox1-1 mutant, and siliques from two plants were measured for the miox1-2 and miox1-3 mutants. Silique measurements are displayed as box plots; the centre line indicates the median value, the box boundaries represent the 25th and 75th percentiles, and the whiskers extend to the minimum and maximum values within 1.5 times the interquartile range. The unpaired Wilcoxon test P value is reported for each miox1 mutant compared to Col-0. j, Representative image of fully elongated siliques in Col-0 and the miox1-1 T-DNA mutant. The scale bar length is shown. For the micrograph in g, results were observed in one stem.
To investigate this question, we examined the intersection of newly identified markers from the subsets of phloem companion and guard cells. This revealed two classes of marker genes: (1) markers that were shared across cell types within the same tissue, organ or organ system (shared markers; Fig. 5d and Supplementary Table 4) and (2) unique cell-type markers that were identified within only phloem companion or guard cell populations of individual sample types (unique; Fig. 5e and Supplementary Table 4). For example, CYTOCHROME P450, FAMILY 709, SUBFAMILY B, POLYPEPTIDE 1 (CYP709B1; AT2G46960) and ARABIDOPSIS NAC DOMAIN CONTAINING PROTEIN 29 (ANAC029; AT1G69490) were both identified as markers within silique guard cells (Supplementary Fig. 14d, left).
Examining the expression of these silique guard cell markers in the context of whole-plant development, we found that CYP709B1 was restricted to the silique organ but was expressed broadly across cell types (shared marker gene), while ANAC029 expression was unique to silique guard cells within the context of whole-plant development (unique marker gene; Supplementary Fig. 14d, right). Consistent with the broad expression of CYP709B1 across silique cell types, we also identified shared markers of other tissues in the phloem companion and guard cell populations (Fig. 5d and Supplementary Fig. 14e). Together, these results demonstrate that transcriptional identities within individual cell types are defined both by the expression of genes shared among cell types within a tissue or organ (for example, flower specific) and by genes under the combined regulation of cell-type and developmental specificity (for example, expression restricted to only one cell type in only one organ, such as silique mesocarp). Extending this cell-type-level analysis to other recurrent cell populations revealed similar results (Supplementary Fig. 14f,g and Supplementary Table 4), demonstrating that this observation was not unique to the cell types of phloem companion and guard cells but is instead widespread across diverse cell types.
To systematically identify organ- and development-specific markers across Arabidopsis development, we compared the pseudobulk expression of marker genes of all 183 major clusters (Supplementary Fig. 15a, calculated from Supplementary Tables 5 and 6; Methods). Of 4,528 genes identified as markers of at least one of the major clusters, 331 (7.3%) genes were uniquely identified as markers within only one dataset (Supplementary Table 4). Consistent with the unique expression patterns in the pseudobulk data, plotting the expression of these markers both in their natively expressed dataset (for example, stem phloem; Fig. 5f,g) and in the globally integrated dataset revealed that the expression of many of these markers (>70%) was restricted to individual clusters and/or subsets of clusters (Supplementary Fig. 15b), demonstrating that our atlas identifies transcripts uniquely expressed in certain cell types or cell states, present only within specific datasets.
Functional characterization of a new cell-type-specific gene in Arabidopsis siliques
We next questioned whether genes with unique expression patterns may have functional relevance within the natively expressed sample type. We evaluated 94 transfer DNA (T-DNA) mutant alleles66 of 46 marker genes uniquely identified or enriched as cluster or subcluster markers within individual datasets (Fig. 5e, Supplementary Fig. 15c and Supplementary Table 4). From these mutants, we identified diverse phenotypes for seven genes (15%), including alterations in leaf morphology and physiology, petiole length, bolting time, premature leaf senescence and abnormalities in silique length and morphology (Fig. 5i,j and Supplementary Fig. 15c). Of note, six of the seven genes were not previously associated with phenotypes, demonstrating the capacity to identify new phenotypes in mutants of genes with unique expression patterns. As an example, we focused on mutants of MYO-INOSITOL OXYGENASE 1 (MIOX1; AT1G14520), where we found that high expression of this gene was restricted to the silique dataset and was enriched within individual subclusters of this organ (Fig. 5h). In miox1 mutants, we observed a reduction (~1 mm) in the length of fully elongated siliques (Fig. 5i,j) without observing extraneous phenotypes in other tissues and developmental stages. These results were consistent in several miox1 mutants, suggesting a unique cell-type-specific role of MIOX1 in silique development throughout the Arabidopsis life cycle. Examining the expression of the other MIOX family members revealed similar trends of subcluster-specific expression in siliques for MIOX2 (AT2G19800), MIOX4 (AT4G26260) and MIOX5 (AT5G56640) (Extended Data Fig. 7), although in contrast to MIOX1, the expression of the other MIOX family members was instead restricted to other clusters and cell types in the silique dataset, which may suggest specific yet distinct roles of myo-inositol metabolism enzymes during silique development.
The hypocotyl hook as a model of spatiotemporally regulated cellular states
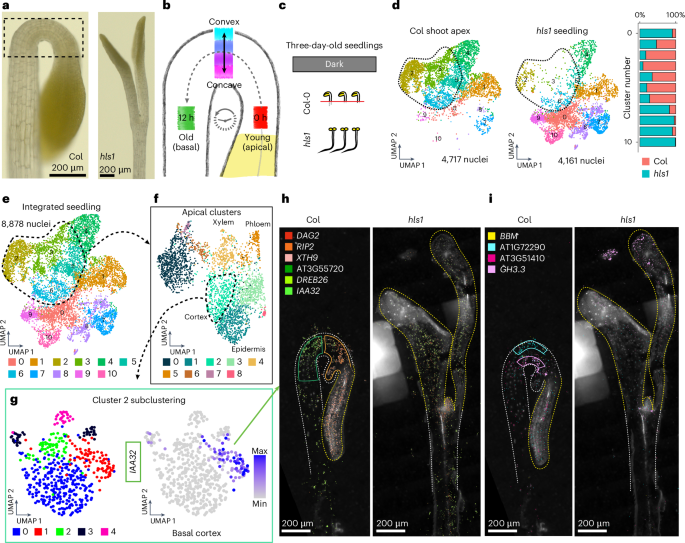
In dicotyledonous plants, the hypocotyl apical hook is a hallmark phenotype of dark-grown (etiolated) seedlings, which is necessary to prevent mechanical damage to the stem cells within the shoot apical meristem as seedlings emerge from soil67. To maintain the apical hook structure (Fig. 6a), it is understood that the opposing activity of the hormones auxin and ethylene causes epidermal and cortex cells to transiently undergo differential rates of cell elongation along the convex–concave axis, but as a ‘standing wave’ of growth68, where individual cells transit from the shoot apical meristem, progress through and ultimately exit the apical hook in fewer than 12 hours69 (Fig. 6b). The transient positions of all individual cells as they pass through the apical hook thus represent unique cellular states at the intersection of developmental and hormonal regulation. We therefore sought to use the apical hook as a model to study cellular states.
a, Bright-field images of the shoot apex of three-day-old dark-grown seedlings of Col-0 (left) and hls1 (right). The scale bar lengths are shown. b, Model of cellular states associated with the development and maintenance of the apical hook. Maximal activity levels of ethylene and auxin are localized to the convex and concave apices of the apical hook, respectively. Domains associated with the apical–basal axis of development from the shoot apical meristem to the basal hypocotyl are also depicted. c, Illustration of the experiments performed. Nuclei were isolated from three-day-old seedlings, with dissected shoot apex tissues collected from Col-0 and whole seedlings from hls1. d,e, Clustering of Col-0 shoot apex cells and whole hls1 seedlings. In d, nuclei from both datasets are plotted separately within the co-embedded UMAP space. The number of nuclei for each genotype among all clusters is depicted as a bar plot (right). Clusters that are overrepresented for cells of the apical hook and underrepresented in hls1 are circled in red. In e, all nuclei from the Col-0 shoot apex and hls1 seedlings are depicted. f, Re-clustering of clusters that majorly represent cells of the apical hook structure. Annotations of select clusters are depicted. A cluster corresponding to cortex cells is circled. g, Left, re-clustering of the cortex cell cluster. Right, expression of a newly identified cortex subcluster marker, IAA32 (AT2G01200). The colour bar represents the expression level. h,i, Spatial locations of transcripts associated with cellular states in the apical hook. The shoot apices of three-day-old dark-grown seedlings of Col-0 (left) and hls1 (right) are depicted. Transcripts with spatial expression patterns enriched within domains of the apical–basal axis of development (h) and the convex–concave domains of the apical hook (i) are depicted. The scale bar lengths are shown. For the micrographs in a, h and i, results were observed in at least eight seedlings for each genotype.
To provide a foundation for identifying cellular states within the apical hook, we generated paired single-nucleus and MERFISH datasets of dissected shoot apices containing the apical hook from wild-type seedlings, as well as whole seedlings of hookless1 (hls1; AT4G37580), which undergoes normal seedling development but specifically lacks the apical hook structure70 (Fig. 6c). Co-clustering of these datasets revealed that specific clusters (clusters 2, 3, 5 and 6) were overrepresented by nuclei of the Col-0 shoot apex and underrepresented in hls1 seedlings, revealing that these clusters represent cells in the apical hook (Fig. 6d,e).
Re-clustering of the apical hook cells revealed additional clusters that correspond to known cell types in hypocotyls (Fig. 6f). Further investigation of heterogeneity within cell types through subclustering analyses revealed a total of 24 subclusters that may represent distinct cellular states in all cell types present in the apical hook. To focus on cell states that may regulate differential growth programs within the apical hook, we focused on cortex clusters, which represent the most abundant cell type in the apical hook by volume71. Subclustering of cortex cluster 2 revealed five discrete cell populations in this cluster (Fig. 6g), where we identified INDOLE-3-ACETIC ACID INDUCIBLE 32 (IAA32; AT2G01200) as a subcluster marker with known expression in the basal concave region of the apical hook72, which we also confirmed in our spatial datasets (Fig. 6h and Extended Data Fig. 8a). We also identified new markers with spatial expression restricted to cortex cells in convex and concave regions of the apical hook (Fig. 6h), as well as along the apical–basal axis of development (Fig. 6i). Additionally, expression of these markers was absent or reduced in straightened hypocotyls of hls1 (Extended Data Figs. 8 and 9), further suggesting a role of cell-state markers in apical hook regulation.
While we were able to identify new markers of apical–basal and convex–concave positioning, we observed varying levels of co-expression of these markers both spatially and at the single-cell level, which suggests further spatial complexity in this tissue structure. This observation is exemplified by the basal apical hook cortex markers IAA32 and DEHYDRATION RESPONSE ELEMENT-BINDING PROTEIN 26 (DREB26; AT1G21910), where we observed that IAA32 expression is uniquely restricted to the basal apical hook, while DREB26 expression is similarly expressed in the basal apical hook but also extends into the basal hypocotyl (Extended Data Fig. 8a). This observation is also reflected in the apical hook single-nucleus dataset, where we observed IAA32 and DREB26 co-expression in the same apical hook cortex cluster (cluster 2; Extended Data Fig. 8b, middle), but IAA32 and DREB26 expression becomes more distinct in apical hook cortex subclusters (Extended Data Fig. 8b, right). Together, these results highlight the fine-tuned spatiotemporal regulation of cortex cell neighbourhoods in the apical hook and suggests that IAA32 and other markers of cellular states in the apical hook may be directly involved in the regulation of differential growth to maintain this structure.
Finally, to understand the combinatorial interaction of cellular states that regulate orthogonal spatial axes aligned with developmental progression (apical–basal) and lateral asymmetry that underlies tissue bending (convex–concave), we examined cells that co-express markers of apical–basal and convex–concave patterning, which represent rare cell neighbourhoods of ten or fewer cells within a whole organism (for example, convex cells of the basal hypocotyl) (Extended Data Fig. 10). Independent analysis of all four cell groups revealed that markers of each of these populations were enriched for distinct and diverse Gene Ontology (GO) terms, many of which are associated with the regulation of growth or development, such as anatomical structure arrangement and pattern specification process, which are associated with apical–convex and apical–concave cell states, respectively (Supplementary Fig. 16). Furthermore, several newly identified markers in enriched GO categories for all cellular states analysed have demonstrated function in apical hook regulation. Our comprehensive analysis of cellular states within the apical hook thus revealed diverse cellular states, represented by over 20 subclusters, as well as a role of spatiotemporally regulated cell-state genes, with pinpoint precision of expression, in wild-type growth and development of the apical hook.
Source link
