Jersey Voters Blame Governor, Utility Companies for Utility Costs
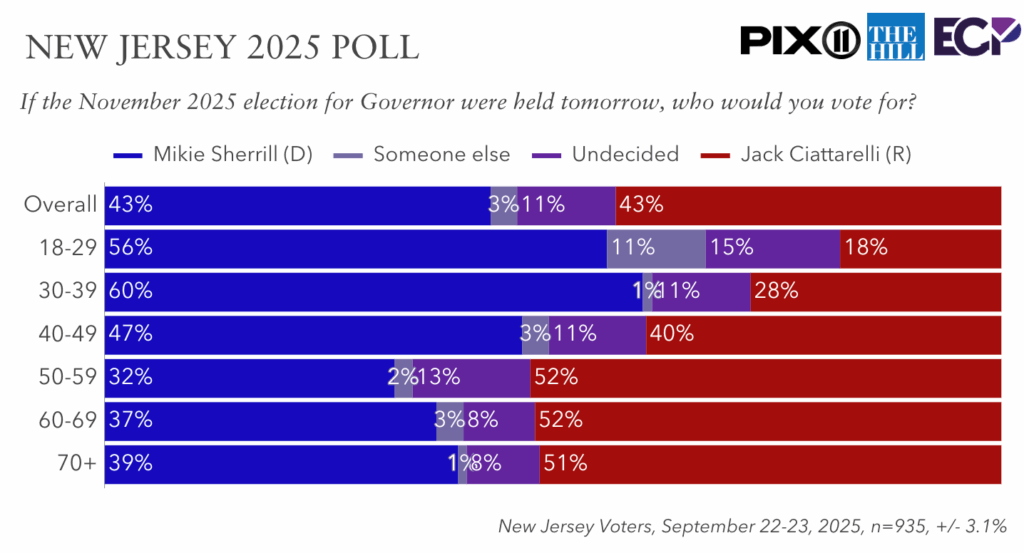
A new Emerson College Polling/PIX11/The Hill survey of New Jersey voters finds 43% of voters support Democrat Mikie Sherrill and Republican Jack Ciatarelli, respectively; 11% of voters are undecided.
“The first Emerson College general election survey of New Jersey’s 2025 election for Governor reveals a tightly contested race in the Garden State,” Spencer Kimball, executive director of Emerson College Polling, said. “Young voters, under 40, break for Sherrill by large margins, 58% to 24%. The race tightens to seven points among voters in their 40s, with Sherrill leading 47% to 40%, then Ciattarelli flips the script among voters over 50, leading Sherrill 52% to 36% among this group.”

“A stark gender divide also emerges among Garden State voters: women break for Sherrill by ten points, 46% to 36%, while men break for Ciattarelli by 12 points, 51% to 39%. Notably, women are over twice as likely to be undecided at 15% compared to 6% of men,” Kimball added.
Governor Phil Murphy holds a 35% job approval rating, and 44% disapprove of the job he is doing; 21% are neutral. Since May, the Governor’s approval rating has decreased five points, from 40% to 35%. President Donald Trump holds a 41% job approval and 51% disapproval rating; 9% are neutral.
“Both President Trump and Governor Murphy are underwater among Jersey voters. Sherrill is trying to tie Ciattarelli to Trump, at the national level, and Ciattarelli is trying to tie Sherrill to Murphy and the cost of living at the state level,” Kimball said.
Voters were asked if they would rather the next governor work with the Trump administration or stand up to the Trump administration. Fifty-one percent prefer they stand up to the administration, while 49% prefer they work with the administration. Since May, sentiment has flipped: those wanting the next Governor to stand up to Trump increased four points from 47% to 51%, and those who prefer the Governor to work with Trump decreased from 53% to 49%.
Economic concerns continue to top New Jersey voters’ concerns: 51% think the economy is the top issue facing the state, followed by threats to democracy (13%), housing affordability (11%), healthcare (6%), immigration policy (5%), and crime (5%).
Regarding the property tax rate in New Jersey, 21% think the Governor is responsible for the rate, 15% think the state legislature is responsible for the rate, 10% town governments, 6% local school districts, and 46% think all of these groups are responsible.
When it comes to utility costs, 30% think utility companies are responsible for the costs in New Jersey, 22% think the governor is responsible, 7% the federal government, and 4% the grid operator; 35% think all of these are responsible.
“New Jersey Democrats blame utility companies for the cost of utilities at 36%, whereas Republicans blame Governor Murphy at 36% — independents are split between the governor (27%) and utility companies (23%),” Kimball added.
Forty-six percent of voters support their school district merging with another to reduce costs, while 22% oppose, and 32% are neutral or have no opinion.
“Opposition is significantly higher among those who are parents to a child between 3 and 18 years old at 37%, compared to 17% of non-parents of this age group,” Kimball noted.
Methodology
The Emerson College Polling New Jersey survey was conducted September 22-23, 2025. The overall sample of New Jersey somewhat/very likely voters, n=935, has a credibility interval, similar to a poll’s margin of error (MOE), of +/- 3.1 percentage points. The data sets were weighted by gender, education, race, age, party registration, previous vote history, and region based on U.S. Census parameters and voter file data.
It is important to remember that subsets based on demographics, such as gender, age, education, and race/ethnicity, carry with them higher credibility intervals, as the sample size is reduced. Survey results should be understood within the poll’s range of scores, and with a confidence interval of 95% a poll will fall outside the range of scores 1 in 20 times.
Data was collected by contacting a voter list of cellphones via MMS-to-web text and emails (lists provided by Aristotle), and an online panel of voters provided by CINT. Panel responses were matched to the Aristotle voter file using respondents’ full name and ZIP code. The survey was offered in English.
All questions asked in this survey with the exact wording, along with full results, demographics, and cross tabulations can be found under Full Results. This survey was funded by Nexstar Media.
Source link