Population characteristics and phenotypes
This study included 274,241 participants from the UKB with nuclear magnetic resonance (NMR) metabolic measures. Analysed participants had a median age of 58.0 (interquartile range, 50.0–63.0) years at the time of blood sample collection, of whom 54.0% (n = 147,994) were females, and 95.1% (n = 260,800) were of white ancestry (Supplementary Table 1). Until November 2023, participants had a median follow-up of 14.9 (interquartile range, 14.1–15.5) years. Blood samples were collected at participants’ baseline visits, and 313 NMR metabolic profiles were measured (Supplementary Table 2). The metabolites’ correlation is shown in Extended Data Fig. 2. Our analysis revealed strong positive correlations, particularly within lipid-related metabolites, reflecting shared biological pathways, while weaker correlations were observed between lipid metabolites and non-lipid classes, such as amino acids and organic acids. The participants were partitioned into three cohorts: a derivation cohort of 148,974 individuals of white ancestry in phase 2, a replication cohort 1 of 111,826 individuals of white ancestry from phase 1 and a replication cohort 2 of 13,441 individuals of non-white ancestry from both phases (Extended Data Fig. 1a).
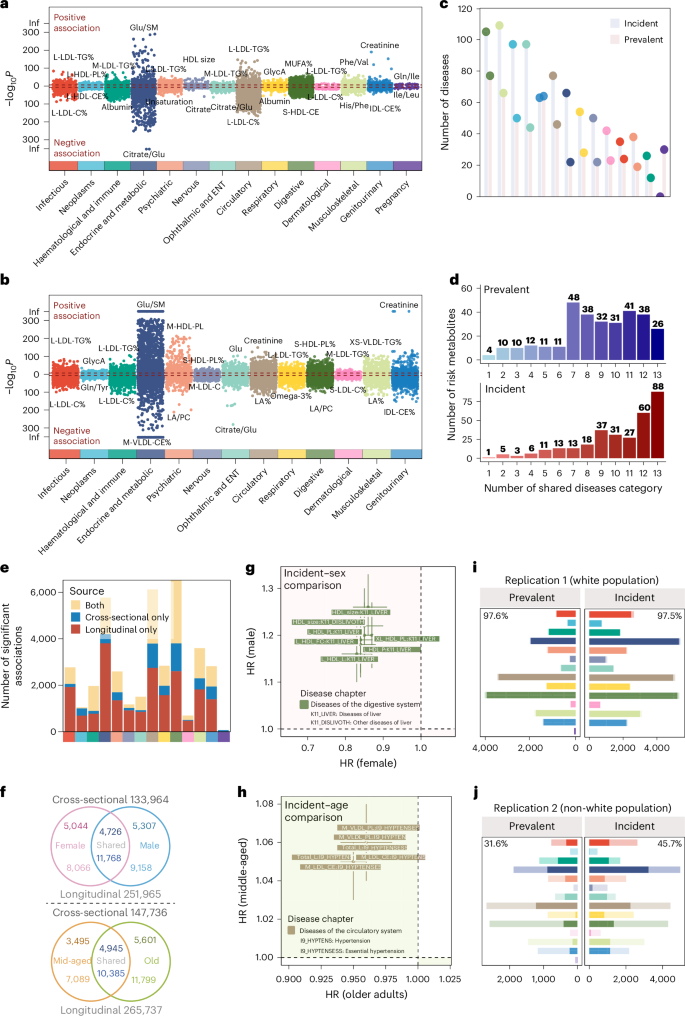
Phenotypes adopted in the study comprise two main categories of diseases and traits. The diseases, defined using International Classification of Diseases (ICD)-10 codes, were classified into prevalent diseases (n = 527, diagnosed before the blood collection) and incident diseases (n = 859, diagnosed after the blood collection; Supplementary Tables 3 and 4). Specifically, for prevalent diseases, digestive diseases (n = 77, 14.6%), musculoskeletal diseases (n = 66, 12.5%) and genitourinary diseases (n = 64, 12.1%) emerge as the three most prominent disease categories (Fig. 2c and Extended Data Fig. 3a). The average number of cases per disease chapter varied between 2,725 and 6,984 (Extended Data Fig. 3c). As for incident diseases, musculoskeletal diseases (n = 109, 12.7%), digestive diseases (n = 105, 12.2%) and neoplasms (n = 97, 11.3%) are the top three categories (Fig. 2c and Extended Data Fig. 3b,c).
a,b, Metabolite–disease associations were revealed by logistic regression (a) and the Cox proportional-hazards model (b), coloured by the ICD-10-based disease chapter. Positive associations (OR > 1 or HR > 1) are above the red dashed line; negative associations (OR < 1 or HR < 1) are below. Only statistically significant associations passing Bonferroni-corrected thresholds are shown: (a) n = 18,594, P < 3.03 × 10⁻7 (0.05/(313 × 527)); (b) n = 34,242, P < 1.86 × 10⁻7 (0.05 / (313 × 859)). M-LDL-TG%, triglycerides to total lipids in medium low-density lipoprotein percentage; L-HDLPL%, phospholipids to total lipids in large high-density lipoprotein percentage; IDL-CE%, cholesteryl esters to total lipids in intermediate-density lipoprotein percentage; S-HDL-CE, cholesteryl esters in small high-density lipoprotein; MUFA%, monounsaturated fatty acids to total fatty acids percentage; M-VLDL-CE%, cholesteryl esters to total lipids in medium very low-density lipoprotein percentage; M-HDL-PL, phospholipids in medium highdensity lipoprotein; M-LDL-C, cholesterol in medium low-density lipoprotein; S-LDL-C%, cholesterol to total lipids in small low-density lipoprotein percentage; LA%, linoleic acid to total fatty acids percentage; LA/PC: Linoleic acid to phosphatidylcholines ratio; XS-VLDL-TG%, triglycerides to total lipids in extra-small very low-density lipoprotein percentage. ENT, ear, nose and throat. c, Number of prevalent and incident diseases by disease chapter. d, Distribution of risk metabolites across disease categories. The x axis represents the number of shared disease categories (1 to 13). The y axis shows the number of associated metabolites. e, Comparison of the number of associations in cross-sectional, prospective analysis, or both, with a colour bar indicating different disease categories. f, Venn diagram of subgroup analyses by sex (top) and age (bottom). Numbers outside circles show total associations tested; upper numbers are for cross-sectional analysis, while lower numbers are for prospective analysis. g,h, Metabolite–disease pairs with inconsistent directions of effect in female versus male (g) and middle-aged versus older (h) individuals in a prospective subgroup analysis, coloured by disease chapter. Error bars represent 95% CIs. i,j, Validation of metabolite–disease associations from the derivation cohort in replication cohort 1 (i) and replication cohort 2 (j). Bars, coloured by disease chapter, show statistically meaningful associations in the derivation cohort, with the darker portion indicating those with P < 0.05 in replication cohorts. The top corner numbers represent the replication proportions within each facet.
Traits were composed of health-related traits (n = 991) and imaging traits (n = 2,151; Supplementary Tables 5 and 6). Health-related traits were classified into ten chapters, with mental health (n = 235) and health and medical history (n = 201) being the top two categories regarding the amount (Extended Data Fig. 3d,e). Imaging traits were extracted from brain magnetic resonance imaging (MRI; n = 1,978), heart MRI (n = 129) and abdominal MRI (n = 44; Extended Data Fig. 3f,g).
Atlas of metabolite–disease associations
Relationships between metabolites and diseases were analysed cross-sectionally (logistic regressions) and prospectively (Cox proportional-hazards regressions) for prevalent and incident diseases, respectively. For cross-sectional analysis, 18,594 (11.3%) metabolite–disease associations were identified at the Bonferroni-corrected threshold of 3.03 × 10⁻⁷ (0.05/(313 × 527)), where haematologic and immune diseases (31.8% = 1,196/(313 × 12)) constituted the highest proportion, followed by endocrine and metabolic diseases (28.6%; Fig. 2a and Supplementary Table 7). The prospective analysis identified 34,242 (13.2%) associations under P < 1.86 × 10⁻⁷ (0.05/(313 × 859)), where endocrine and metabolic diseases made up the largest proportion of 26.0% (5,378/(313 × 66)), followed by infectious diseases (24.1%; Fig. 2b and Supplementary Table 8). Less than half (42.5%) of associations were concurrently observed as statistically significant in cross-sectional and prospective analyses (Fig. 2e).
In cross-sectional analysis, 43.5% (n = 136) of metabolites were associated with ≥10 disease chapters, while in prospective analysis, nearly two-thirds (65.8%, n = 206) were associated with ≥10 disease chapters (Fig. 2d). Notably, the ratio of cholesterol to total lipids in large low-density lipoprotein (LDL) particles (L-LDL-C%) and the ratio of triglycerides to total lipids in large LDL% (L-LDL-TG%) were the top two disease-associated metabolites, and they were found associated with 203 and 188 prevalent diseases and 323 and 317 incident diseases, respectively (Supplementary Table 11).
In subgroup analyses of sex and age (<60 and ≥60 years), metabolome-disease heterogeneity was observed, with nearly half of the associations identified uniquely. Specifically, for sex, 4,726 cross-sectional associations were identified in both females and males, while 10,351 were uniquely found in females (n = 5,044) and males (n = 5,307). For age, 4,945 cross-sectional associations were shared, with 9,096 being unique (Fig. 2f). Notably, seven associations with divergent effect directions were explicitly identified in diseases of the digestive system, differing between females and males. For instance, high-density lipoprotein (HDL) size, total lipids in large HDL (L-HDL-L) and free cholesterol in large HDL (L-HDL-FC) exhibited protective effects against liver diseases in females (hazard ratio (HR; 95% confidence interval (CI)) = 0.86 (0.82–0.91), 0.83 (0.79–0.87) and 0.84 (0.80–0.88), respectively), but were associated with increased risk in males (HR (95% CI) = 1.26 (1.20–1.33), 1.16 (1.10–1.22) and 1.19 (1.12–1.25), respectively; Fig. 2g and Supplementary Table 12). The age-stratified subgroup analysis revealed six associations in the prospective analysis had inconsistent effects, all within the circulatory system. For instance, total lipids in lipoprotein particles (Total-L), cholesteryl esters in medium LDL (M-HDL-CE) and phospholipids in medium VLDL (M-VLDL-PL) were risk factors for middle-aged but protective for older individuals (Fig. 2h and Supplementary Table 13). Interaction analyses between metabolites and sex, as well as metabolites and age, revealed consistent findings with subgroup analysis, that only a small number of associations exhibited interactions with age or sex across phenotype groups (Supplementary Tables 7 and 8).
Atlas of metabolite–trait associations
Next, relationships between metabolites and traits were examined, which included 991 health-related traits and 2,151 imaging traits. The health-related traits were derived from physical measurements, questionnaires, and blood and urine assays of UKB participants at recruitment. The imaging traits were extracted from MRI scanning at the imaging visit. Although these traits are not disease diagnosis information, they may be closely related to body health by acting as risk factors, clinical manifestations signifying disease status, and others.
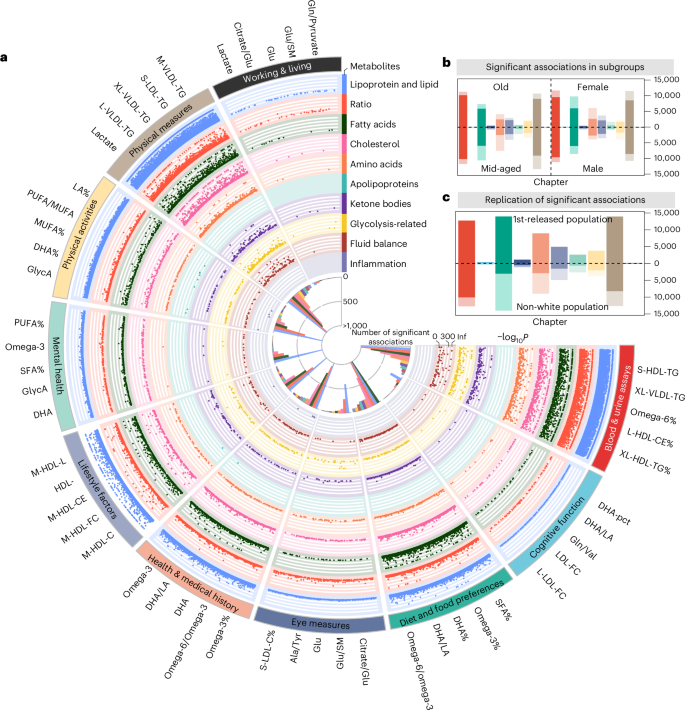
We found 62,887 associations (20.3% = 62,887/(991 × 313)) for health-related traits under a Bonferroni-corrected P < 5.08 × 10⁻⁸ (0.05/(313 × 3,142)). Associations were found mainly in diet and food preferences (n = 14,050, 22.3%) and physical measurements (n = 13,986, 22.2%). The high light scatter reticulocyte counts in blood and urine assays were found to be associated with the most metabolites (n = 278, 88.9%), where the omega-6 fatty acids to total fatty acid percentage (omega-6%) (regression coefficient β = −19.34, P < 1 × 10−300) and triglycerides in small HDL (β = 19.77, P < 1 × 10−300) showed the most pronounced associations. Among metabolite categories, metabolic ratios (n = 9,903) and lipoproteins and lipids (n = 8,660) were found to have the largest number of associations (Fig. 3a and Supplementary Table 9).
a, Fuji plot of associations between metabolites and health-related traits (n = 62,887). This circular plot displays statistically meaningful associations identified between metabolites and health-related traits. The outer ring lists the top five metabolites with the most statistically significant associations per trait category. Each dot represents a statistically meaningful association, with categories labelled around the perimeter. Colours indicate different metabolite categories. b, Associations between metabolites and health-related traits in subgroup analyses. Bars are coloured by trait categories, with darker segments indicating associations common to both sex or age subgroups. Numbers show the proportion of shared associations within each subgroup. c, Validation of associations in the replication cohort 1 (upper) and 2 (lower). Bars, coloured by trait categories, represent statistically meaningful associations in the derivation cohort. Darker segments indicate associations with P < 0.05 in replication cohorts. Numbers show the replication rate within each cohort. PUFA, polyunsaturated fatty acid; MUFA, monounsaturated fatty acid; DHA, docosahexaenoic acid.
Metabolite–trait associations identified in the discovery cohort were successfully replicated in the subgroup analysis across various demographics: 66.9% in females, 77.3% in males, 81.7% in older adults and 61.1% in middle-aged individuals. Among these, 542 associations demonstrated different effect directions in sex (n = 198) and age (n = 344) subgroups (Fig. 3b, Extended Data Fig. 4a and Supplementary Tables 13 and 14). For instance, 31 lipoproteins and lipids associated with alcohol consumption exhibited opposite directional associations between females (negative) and males (positive), aligning with previous studies indicating that influential factors such as body composition, hormonal levels and genetic predispositions play critical roles in how men and women metabolize and respond to alcohol differently18. Furthermore, 47 metabolomes associated with cognitive function exhibited opposite effects between middle-aged (positive) and older (negative) groups, as supported by previous research highlighting the complexity of metabolic influences on cognitive function across the lifespan, including variations in brain metabolism, vascular health and oxidative stress accumulation19.
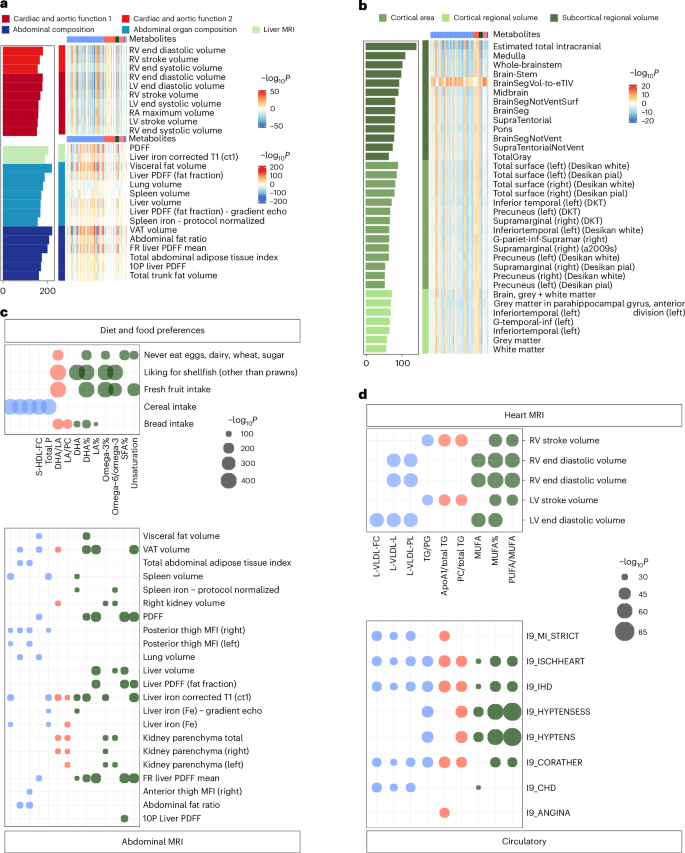
For imaging traits, 10,752 statistically significant associations were identified under P < 5.08 × 10⁻⁸ (Fig. 4a,b and Supplementary Table 10). The associations were primarily found in cardiac and aortic function (n = 2,636). The most notable associations were creatinine to kidney MRI (β = −8.626, P = 4.58 × 10−221) and triglycerides in very large HDL (XL-HDL-TG%) to abdominal organ composition (β = −0.132, P = 2.17 × 10−219), respectively (Extended Data Fig. 4b). In brain imaging, metabolites exhibited relatively stronger associations with T1 structural brain MRI, and the most statistically meaningful associations included glycoprotein acetyls (GlycA; β = −7.868, P = 4.89 × 10⁻¹⁷) and polyunsaturated fatty acids/monounsaturated fatty acids (β = −7.894, P = 4.58 × 10⁻¹⁶) to subcortical regional volume (Extended Data Fig. 4c).
a,b, Associations between metabolites and imaging traits. Associations with abdomen and heart imaging (a) and brain imaging (b) traits. Rows represent specific imaging traits, with a colour gradient indicating significance levels (darker colours denote higher significance). The bar plot on the left shows the count of statistically meaningful metabolites per imaging trait. Statistical significance was defined using a Bonferroni-corrected threshold of P < 5.08 × 10⁻⁸ (0.05/(313 × 3,142)). c,d, Shared metabolites between imaging and health-related traits or diseases. c, Shared metabolites between abdominal imaging traits and diet and food preferences. d, Shared metabolites between heart imaging traits and various incident circulatory diseases. Point size indicates the magnitude of P values, with larger points representing more statistically meaningful associations (smaller P values). Bonferroni-adjusted significance thresholds were P < 5.08 × 10⁻⁸ (0.05/(313 × 3,142)) for imaging and health-related traits, and P < 1.86 × 10⁻7 (0.05/(313 × 859)) for incident diseases. LV, left ventricle; MFI, muscle fat infiltration; PDFF, proton density fat fraction; DKT, Desikan-Killiany-Tourville; FR, fat referenced; RV, right ventricle; VAT, visceral adipose tissue; RA, right atrium; PG, phosphoglycerides; TG, triglycerides.
The metabolome bridges the relationship between diseases and traits
Fourteen metabolites exhibited associations with both diet and food preferences and abdominal MRI analysis. Additionally, heart MRI analysis revealed nine common metabolites associated with circulatory system diseases (Fig. 4c,d and Supplementary Tables 15 and 16). Besides, we calculated the distribution of metabolites according to their categories across different disease and trait groups (Supplementary Tables 17–20). The results revealed that lipoproteins and lipids were the most frequently associated metabolite categories with both diseases and traits. Fatty acids and metabolite ratios emerged as the second and third most frequently associated categories, respectively.
In addition, we included estimated glomerular filtration rate (eGFR) as an additional covariate in the regression models. The results indicated that most of the associations across different phenotype categories (90.0% in incident diseases, 87.1% in prevalent diseases, 92.7% in the health-related traits and 76.0% in imaging traits) remained statistically meaningful (Supplementary Tables 7–10), indicating the associations between metabolites and disease/traits were not largely impacted by eGFR.
Replication of metabolite–phenotype associations
To validate the associations identified, we conducted replication analysis separately in white and non-white ancestry groups, using a statistically meaningful threshold determined by the Benjamini–Hochberg procedure. The white ancestry population verified the majority findings of 18,148 (97.6%) and 33,396 (97.5%) associations were successfully replicated for cross-sectional and prospective metabolite–disease analysis, respectively. In contrast, for the non-white population, 4,638 (31.6%, among 14,684 associations available to validate) and 14,096 (45.3%, among 31,103 associations available to validate) associations were replicated, indicating a notable heterogeneity between the two ancestry groups (Fig. 2i,j).
The replication of health-related and imaging traits in the white population examined 73,639 available associations, and 71,613 (97.2%) were successfully verified. The non-white population exhibited a much lower proportion of 42.0%, where 30,975 associations were validated among 73,639 available ones (Fig. 3c and Extended Data Fig. 4d,e).
Metabolite variation assessments at different times characterize disease progression
To uncover the variations in metabolite levels at different times before disease diagnosis, we delineated their variational patterns 15 years preceding the disease onset. We leveraged a nested case–control design in which the disease onset date for each case was aligned, and healthy controls were assumed to have the same proxy onset dates as their matched cases (Extended Data Fig. 5a). Among 34,242 statistically meaningful metabolite–disease pairs discovered in prospective association analysis, metabolites in 19,691 (57.5%) pairs emerged with variations a decade preceding disease onset, where L-LDL-TG% was found in the largest number of diseases (n = 246). In the meantime, metabolites in 10,275 (30.0%) pairs started to vary within 5 years before disease onset, and the degree of unsaturation in fatty acids accounted for the most diseases (n = 96; Supplementary Table 21).
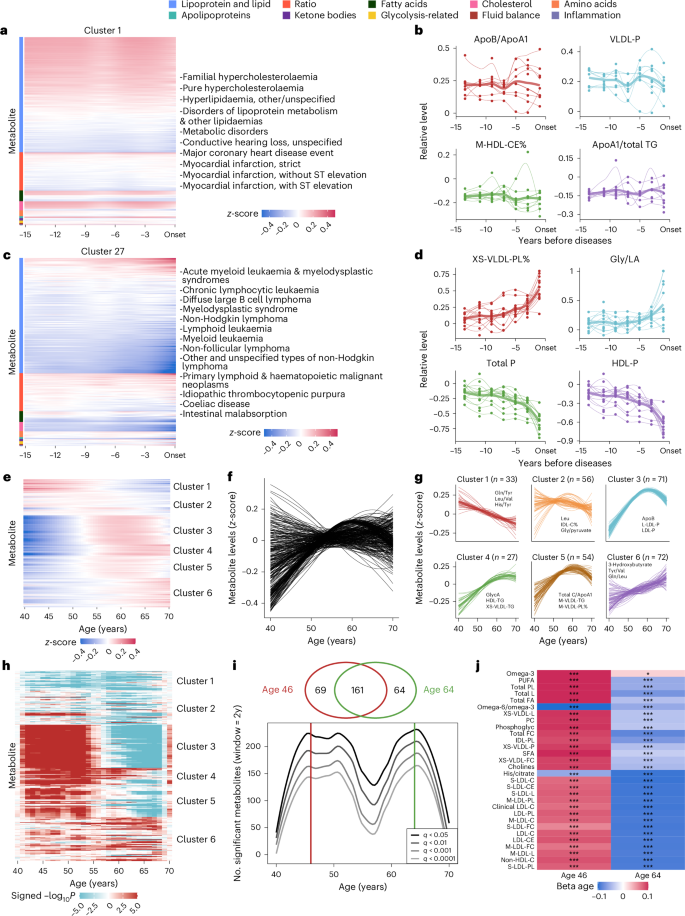
To illuminate the metabolite variational patterns, diseases were grouped into 44 clusters based on the z-score-transformed metabolic measurements across multiple time intervals before diagnosis (Supplementary Table 22). There were seven clusters with more than 30 diseases and eight clusters with only one disease. Specifically, cluster 1 encompassed metabolic and cardiovascular disorders and auditory impairment (Fig. 5a). These disorders shared underlying biological mechanisms like lipid dysregulation and atherosclerotic processes, often exacerbated by systemic inflammatory responses20 and endothelial dysfunction21. Cluster 27 comprised a spectrum of haematological malignancies, associated disorders and other primary lymphoid and haematopoietic neoplasms (Fig. 5c). These conditions were characterized by haematopoiesis and immune regulation disruptions, often linked to genetic mutations and immune dysfunctions22.
a,c, The heat maps depict representative cluster 1 (a) and cluster 27 (c) of incident diseases, grouped based on hierarchical clustering using metabolite levels assessed at different timeframes before diseases. Metabolite levels have been z-scored and estimated using the LOESS method to standardize the data. b,d, The line plots show the z-scored levels of selected metabolites over the 15 years preceding disease onset in cluster 1 (b) and cluster 27 (d). The selected metabolites include the two most positively and two most negatively associated with the diseases. Each line represents the variational patterns of a specific disease, with thicker lines indicating the averaged patterns for all diseases within a particular cluster. The x axis represents the years before disease onset, and the y axis represents the relative metabolite levels. The z-score transformation was performed by subtracting the mean value of the controls and dividing by the variance of the controls to standardize the data. e, Heat map of plasma metabolite levels across ages. The x axis represents age in years; the y axis lists individual metabolites. Blue indicates lower levels, and red indicates higher levels. f, The metabolite variations during ageing. Each line represents the z-scored levels of an individual metabolite across age. Lines were fitted using the LOESS method. g, The metabolite variations for six clusters based on similar patterns defined by hierarchical clustering. The x axis shows the age (40–70 years), and the y axis shows z-scored metabolite levels. Thin lines represent individual trajectories, and thick lines indicate cluster averages. The number of metabolites in each cluster is indicated, and the most statistically meaningful metabolites are plotted. h, Heat map illustrating the waves of ageing metabolites. The colour scale represents signed −log10P. i, The line plot shows the number of metabolites (y axis) as a function of age (x axis), with peaks at ages 46 and 64 derived from the DE-SWAN method. Lines represent different significance levels (q < 0.05, q < 0.01, q < 0.001, q < 0.0001). Venn diagram shows intersections of metabolites at peak ages. j, Top 15 metabolites identified at ages 46 and 64. Red and blue represent local increases and decreases, respectively. *q < 0.01, ***q < 0.001. LOESS, locally estimated scatterplot smoothing.
We highlighted the changes of representative metabolites within each cluster to elucidate their shared patterns preceding disease onset. For cluster 1, the ratio of metabolites apolipoprotein B to apolipoprotein A1 (ApoB/ApoA1) and cholesteryl esters in medium HDL (M-HDL-CE) exhibited constant differences above or below the reference level of 0 throughout the 15 years (Fig. 5b). For cluster 27, phospholipids to total lipids in very small VLDL percentage (XS-VLDL-PL%) and glycine/linoleic acid (Gly/LA) remained stable until 5–10 years, while they were observed to have noticeable upward trends 5 years before onset. Meanwhile, total concentration of lipoprotein particles (Total P) and concentration of HDL particles (HDL-P) witnessed a decline during the 15-year period before disease onset (Fig. 5d). In addition, clusters 22 and 34 were demonstrated as examples of clusters sharing similar metabolite variation before disease onset, offering critical insights into the temporal dynamics of disease progression (Extended Data Fig. 5b,e).
Metabolites assessed at different ages reflect ageing patterns
Considering age as the foremost indicator of human health, we investigated the variations of metabolites assessed at different ages during individuals’ baseline visits. z-scored metabolic measurements were grouped into six clusters with distinct variational patterns across 40 to 70 years (Fig. 5e–g and Supplementary Table 23). Specifically, metabolites that fell in clusters 1 and 6 were observed to have monotonic trends of consistent increase and decrease, respectively. Clusters 3, 4 and 5 exhibited obvious nonlinear patterns, featuring a pronounced rise until age 60, followed by either stabilization or decline. Furthermore, our analysis uncovered that among the 299 metabolites linked to ageing, 297 of them exhibited interactions with sex (Extended Data Fig. 6a–f and Supplementary Table 24).
In addition, to quantify the metabolomic changes occurring during ageing, the differential expression-sliding window analysis (DE-SWAN)23 identified two crests in metabolite expressions at ages 46 and 64 (Fig. 5h–j and Supplementary Table 25). Notably, although the top 15 age-related metabolites differed at ages 46 and 64, there was an obvious overlap (n = 161; Fig. 5i). Metabolites in cluster 1, for example, the ratio of omega-6 fatty acids to omega-3 fatty acids (omega-6/omega-3) and the histidine-to-citrate ratio (His/Citrate), exhibited a consistent decreasing trend at both crests, reflecting their age-associated decline. In contrast, most of the top age-related metabolites were from clusters 3, 4 and 5, and they largely followed converse directions that increased at age 46 and decreased at age 64 (Fig. 5j and Supplementary Table 26). These findings imply that ageing is a dynamic process characterized by waves of changes in plasma metabolites.
Machine-learning-based MetRS facilitates disease discrimination
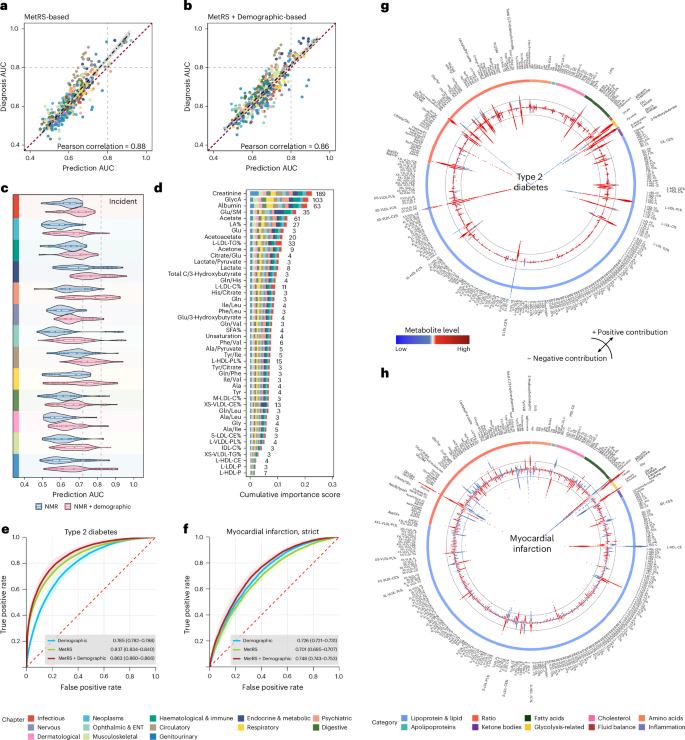
To investigate the discriminative capability of the metabolome, we leveraged machine learning to establish MetRS as metabolic risk representations for prevalent and incident diseases. The MetRS exhibited comparable performance for both, with a Pearson correlation of 0.88 between the area under the receiver operating characteristic (ROC) curves (AUC). The MetRS for prevalent diseases slightly outperformed that for incident ones, while incorporating demographic data further aligned the performance (Fig. 6a,b).
a,b, Correlation between AUC values of 472 shared endpoints in incident diseases based on the MetRS model (a) and the MetRS + Demographic model (b). MetRS leveraged the top 30 metabolites based on the ranked importance scores. Each dot represents a distinct disease endpoint. The dashed regression line represents the best-fit linear model between predicted and observed AUCs. The shaded band around the regression line denotes the 95% CI. c, Discriminative performances of metabolites in disease prediction (AUCs) based on two models: MetRS and MetRS + Demographic. Violin plots represent the distributions of AUC values of specific disease chapters (the analysed diseases within each chapter are provided in Supplementary Table 4). The violin plot ranges represent the minimum to maximum values, box ranges (quartiles) and median values. d, Stacked bar plot showing metabolites’ cumulative importance represented by normalized information gain, derived based on light gradient-boosting machine (LightGBM) models. Numbers indicate the count of diseases where each metabolite achieved top predictive importance. Metabolites served as the top contributor for at least three diseases included in this chart. e,f, ROC curves for predicting T2D (e) and myocardial infarction (f) using the Demographic model alone, MetRS alone and MetRS + Demographic models. ROC curves are shown with shaded bands indicating 95% CIs. AUC values are reported as mean ± 95% CIs. g,h, Circular SHAP value plots illustrating metabolites’ contributions to T2D (g) and myocardial infarction (h) predictions. The coloured outer ring represents metabolite groups. The width of the bars located on the inner ring indicates the extent of metabolites’ contribution to disease prediction, with wider bars reflecting a greater contribution. The top 30 important metabolites are marked in bold. The colour of the bar represents the magnitude of metabolites, ranging from low (blue) to high (red), as depicted in the colour bar between g and h. Deviations towards the centre and periphery signify negative (protective) and positive (risk) contributions, respectively. Colour panels are shared in a–d, representing disease chapters, and in g and h, representing metabolite categories, shown at the bottom. BMI, body mass index; TDI, Townsend deprivation index.
For disease prediction, MetRS exhibited moderate to excellent discriminative performance with AUCs surpassing 0.7 for 100 (11.6%) incident diseases, among which 28 of them witnessed good AUCs exceeding 0.80, especially in endocrine and metabolic diseases (n = 13). Of note, the MetRS excellently predicted future diabetic complications, for example, diabetic maculopathy (AUC = 0.921 (95% CI, 0.914–0.928)), diabetic kidney failure (AUC = 0.919 (0.906–0.930)) and type 2 diabetes (T2D) with peripheral circulatory complications (AUC = 0.913 (0.898–0.926)). By integrating MetRS with demographic information, prediction performance demonstrated improvement that 81 diseases obtained AUCs that surpassed 0.8. In comparison to demographic information, MetRS alone exhibited better performance (DeLong P < 0.05) in 61 (7.1%) diseases; moreover, MetRS demonstrated added values on top of demographic information (AUC of MetRS + Demographic greater than of demographics alone, DeLong P < 0.05) in 527 (61.4%) diseases. The added values of MetRS largely existed in disease categories of digestive, circulatory and endocrine/metabolic diseases (Fig. 6c and Supplementary Table 29).
For the classification of prevalent diseases, 35 MetRS yielded a good performance of AUC > 0.8, particularly in circulatory (n = 14) and endocrine and metabolic (n = 10) diseases. The MetRS witnessed excellent diagnosis for type 1 diabetes (T1D; AUC = 0.944), T2D (AUC = 0.941), diabetic maculopathy (AUC = 0.940) and chronic kidney disease (CKD; AUC = 0.933). Furthermore, in combined MetRS with demographics, 94 (17.8%) diseases showed AUC > 0.8. In comparison to demographic information, MetRS alone showed better performance in 17.8% (n = 94) of diseases; moreover, MetRS illustrated added values to demographics in 61.3% (n = 323) of diseases, which were mainly found in digestive and circulatory diseases (Extended Data Fig. 7a and Supplementary Table 27).
To identify critical metabolic markers of disease discrimination, we sorted the metabolites based on their importance. Of note, creatinine, GlycA, albumin and acetate were top-ranked markers in both prevalent disease classification and incident disease prediction. Specifically, creatinine and GlycA emerged as the most influential markers among 189 (22.0%) and 103 (12.0%) diseases in predictions (Fig. 6d and Supplementary Table 30), while they were dominant in 100 (19.0%) and 80 (15.2%) diseases for classification (Extended Data Fig. 7b and Supplementary Table 28). The MetRS demonstrates obvious patterns of correlation within and between disease groups (Extended Data Fig. 8), which aligns with previous findings, indicating potential shared underlying metabolic pathways9,24.
The prediction of T2D and myocardial infarction obtained AUCs of 0.863 (0.860–0.866) and 0.748 (0.743–0.753), respectively (Fig. 6e,f), with classification both showing much better performance of 0.952 (0.949–0.955) and 0.917 (0.913–0.921; Extended Data Fig. 7c,d). As depicted in Fig. 6g, SHapley Additive exPlanations (SHAP) values25 revealed an elevated ratio of glucose to sphingomyelins (Glu/SM) and glucose levels increased future T2D risk, whereas a decreased ratio of cholesteryl esters to total lipids in the very small VLDL percentage (XS-VLDL-CE%) suggests reduced risk. Increasing creatinine and the glutamine/glycine ratio (Gln/Gly) showed a higher risk of a future myocardial infarction, while higher cholesteryl esters in large HDL (L-HDL-CE) and albumin levels conferred protection (Fig. 6h). Consistent findings were found in prevalent diseases (Extended Data Fig. 7e,f).
Mendelian randomization and colocalization prioritize causal metabolites
To further elucidate potentially causal relationships between metabolites and diseases and identify potential therapeutic targets, Mendelian randomization and colocalization analyses were performed. We identified 7,570 potentially causal metabolite–disease associations (q value < 0.05) in forward Mendelian randomization analyses (Supplementary Table 31). The number of identified associations per metabolite ranged from 1 to 101. Across 11 disease categories, circulatory (n = 1,914) and endocrine and metabolic (n = 1,250) categories had the most associations. In sensitivity analyses, 6,196 (81.9%) metabolite–disease associations remained statistically meaningful after excluding single nucleotide polymorphisms (SNPs) linked to dietary intake (Supplementary Table 32). When a stricter instrumental variables selection was applied (Methods), the number of associations was 544 (Supplementary Table 33). Of these, 454 associations were consistently statistically meaningful across both the primary and sensitivity analyses (Supplementary Table 34).
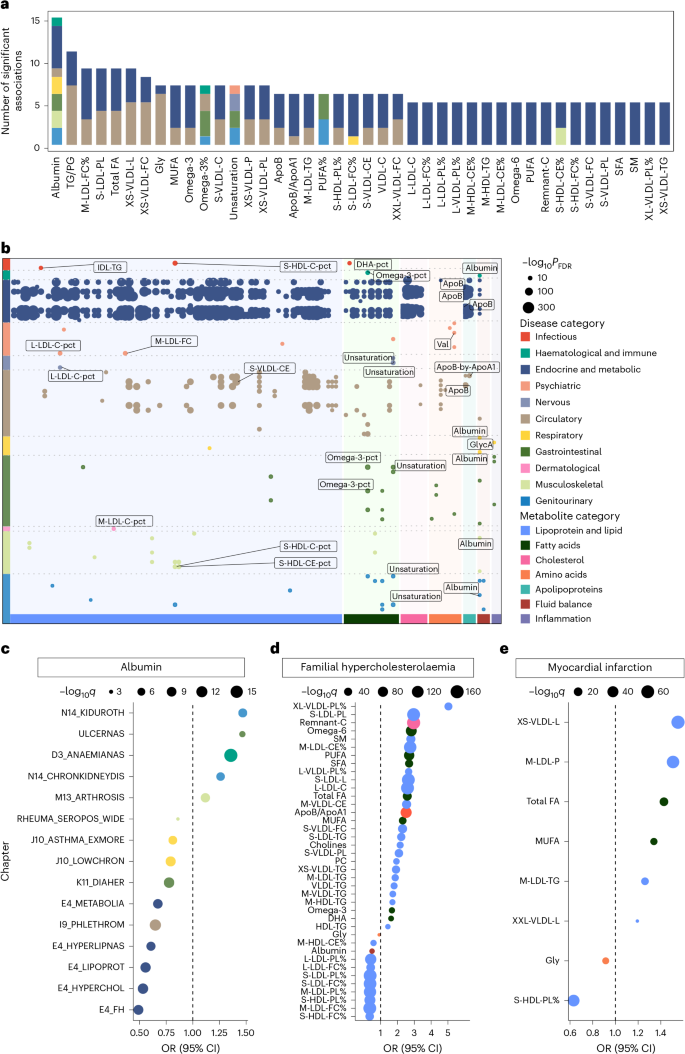
Among the 454 shared associations, the number of identified associations per metabolite ranged from 1 to 15 (Fig. 7a). Among the 11 disease categories, endocrine and metabolic (n = 295) and circulatory categories (n = 87) had the highest numbers of associations (Fig. 7b). Albumin was associated with most diseases (n = 15), positively linking to a higher incidence of ulcerative colitis, certain types of anaemias and CKD (Fig. 7c). Moreover, the ratio of phospholipids to total lipids in the very large VLDL percentage (XL-VLDL-PL%) exhibited the largest effect size in increasing the risk of familial hypercholesterolaemia (odds ratio (OR) = 5.03 (3.97–6.38), q value = 7.39 × 10−39), while the ratio of free cholesterol to total lipids in the small HDL percentage (S-HDL-FC%) was the most evident protective metabolite (OR = 0.35 (0.30–0.40), q value = 4.28 × 10−48; Fig. 7d). Furthermore, total lipids in very small VLDL (XS-VLDL-L) exhibited the strongest association with increased risk of myocardial infarction (OR = 1.55 (1.48–1.63), q value = 1.56 × 10−64), while the ratio of phospholipids to total lipids in the small HDL percentage (S-HDL-PL%; OR = 0.63 (0.59–0.67), q value = 7.03 × 10−48) exhibited the most notable protective effect (Fig. 7e).
a, Stacked bar plot showing potentially causal metabolites most correlated with diseases, coloured by disease chapter. Metabolite–disease pairs that were consistently statistically meaningful across both the primary and sensitivity analyses were included. b, Summary of metabolite–disease causal relationships that were consistently statistically significant across both the primary and sensitivity analyses. The x axis represents metabolite categories, the y axis lists disease chapters, and the dots represent the statistically meaningful causal relationships between metabolites and diseases. Colours represent disease chapters, and annotations indicate the top three diseases (by P value) in each disease chapter. The dot size reflects significance level (−log10q), with larger dots indicating higher significance. FDR, false discovery rate. c, Mendelian randomization results for albumin and various diseases. The x axis shows the OR value, with diseases coloured by chapter. The size of the dots represents the significance level (−log10q), where q values were derived from two-sided tests and adjusted for multiple comparisons using the FDR method. Full disease names corresponding to each abbreviation are provided in Supplementary Table 4. d,e, Results of Mendelian randomization analysis for various metabolites and familial hypercholesterolaemia (d) and myocardial infarction (e). The x axis represents the OR value, with metabolites listed along the y axis. Dot size indicates significance. P values were computed using two-sided tests and corrected for multiple testing using the FDR method.
The investigation into potential causality also provided clues that certain diseases may influence metabolite levels. Reverse Mendelian randomization analysis identified 2,679 disease–metabolite pairs, with triglycerides to total lipids in the large LDL percentage (L-LDL-TG%) associated with the most diseases, potentially influenced by genetic liability to 175 diseases across 12 categories (Extended Data Figs. 9 and 10 and Supplementary Table 35). Interestingly, albumin levels also showed reciprocal causal associations with genetic liability to the risk of ulcerative colitis, certain types of anaemias and CKD.
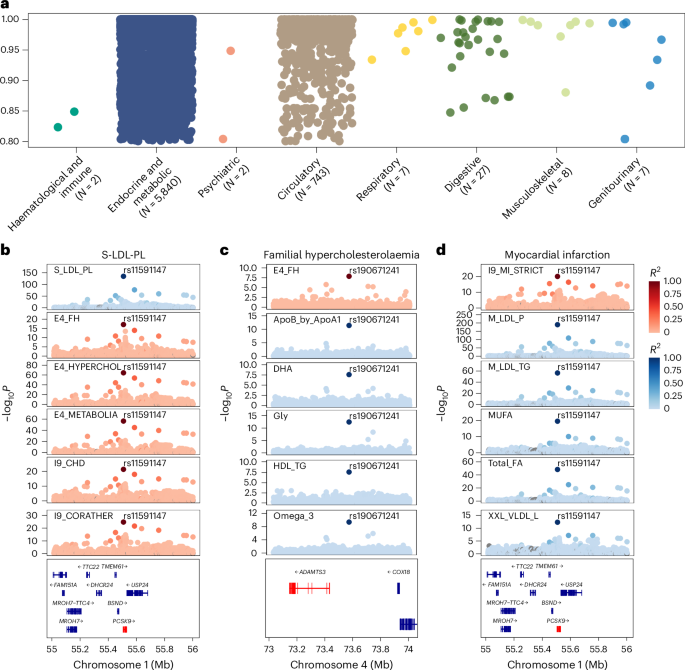
For a potentially causal association implicated in the Mendelian randomization analysis, we further conducted colocalization analysis to investigate the shared genetic determinants. Among the 454 metabolite–disease associations, 402 had profiles supportive of colocalization (PP.H4 > 0.8; Supplementary Table 36). Evidence of shared genetic architecture was identified across a range of disease categories, with the endocrine metabolic and circulatory categories exhibiting the highest number of colocalized signals (Fig. 8a). Among all the loci, rs2954021 mediated the most metabolite–disease associations. For instance, the ratio of triglycerides to phosphoglycerides demonstrated colocalization evidence with several cardiovascular and metabolic diseases at rs964184. We also observed colocalization evidence between non-alcoholic fatty liver disease and alanine content at rs964184.
a, Colocalization analysis of metabolite–disease associations. The y axis lists the disease categories, and the number of associations for each category is indicated. The x axis represents the posterior probability of colocalization, ranging from 0.80 to 1.00. Dots represent colocalized metabolite–disease associations, coloured by disease category. b–d, Colocalization of genetic variants with metabolites and diseases. b, Statistically meaningful colocalization signals between the genetic variant rs11591147 and S-LDL-PL with multiple diseases. c, Colocalization relationships for familial hypercholesterolaemia at the genetic variant rs190671241 with several metabolites. d, Colocalization relationships for myocardial infarction with several lipoprotein lipids at the genetic variant rs11591147. Each plot shows the −log10P values along the chromosome position; the colour coding in all panels represents the linkage disequilibrium (R2) with the top variant.
Among all the metabolites, phospholipids in small LDL (S-LDL-PL) had the most colocalized signals, with 176 shared variants associated with nine unique diseases. For example, rs11591147 may be responsible for the association between S-LDL-PL and multiple diseases, including familial hypercholesterolaemia, pure hypercholesterolaemia, major coronary heart disease events, coronary atherosclerosis, ischaemic heart disease and angina pectoris (Fig. 8b). Notably, rs11591147 in PCSK9 was associated with LDL level and coronary artery disease risk across diverse populations26,27,28. Our findings further provided compelling evidence that rs11591147 is likely the causal variant underlying the widespread associations between metabolites and various diseases. In addition, familial hypercholesterolaemia exhibited a colocalization relationship with multiple lipoproteins and lipids, fatty acids, along with glycine, remnant cholesterol, albumin, and a ratio related to apolipoprotein at rs190671241. Myocardial infarction showed strong evidence of colocalization with several lipoprotein lipid concentration indicators related to LDL and VLDL at rs11591147 (Fig. 8c,d).
We conducted sensitivity analysis for Mendelian randomization and colocalization analysis using the UKB-derived metabolite genome-wide association studies (GWAS) dataset. Detailed results are shown in Supplementary Tables 37–39.
Interactive web tool enables in-depth exploration of metabolome–phenome atlas
To facilitate an in-depth exploration of the detailed results, an interactive web tool (https://metabolome-phenome-atlas.com/) was structured into four sections: (1) epidemiological association (disease-/trait-/metabolite-wide association analysis), (2) metabolite variation assessments at different times and ages, (3) genomic association (Mendelian randomization and colocalization analysis) and (4) disease discrimination (machine-learning classification analysis). The web tool was established under the CC BY-NC-ND 4.0 license for noncommercial use only.
Source link
